Jan 28

Tools, Practices and Actions – From Information to Knowledge

Screenshot of CompendiumNG

CompendiumNG allows stakeholders to quickly create visual maps on a topic using nodes and links. In this example different ideas regarding a problem are collected for assessment. It is possible to adjust the appearance of links and node labels. Source: www.CompendiumNG.org

Prior to a recent workshop a question was circulated that looked as if it was tailored to get my response. I stumbled on some great answers to this question over the course of my master’s research into project-based learning design: “Compendium; Dialogue Mapping; Let’s Do It!” I said, and they asked for more information. I replied by pulling some key points from the best articles I have into the following message and sending it with the full articles to my colleagues who posed the question. Where will this lead?

Question, brainstorming on Effective Communication

What tools, practices, or actions could facilitate greater collaboration and cooperation between units?

To Whom It May Concern:

At the recent workshop I mentioned tools, practices and actions we can take right away to address communication issues raised in previous meetings and surveys. You asked me to send you more information. Thank you for this opportunity. Please see below:

Tool:
There are many resources on this tool on line. It’s open source and has been branched by various groups of educators. CompendiumLD is specifically for learning design, but CompendiumNG, aspires to be the Next Generation of Compendium. N.b.: The Compendium tool is suitable for mapping external “focus group” type dialogue involving many stakeholders, a small meeting, or anything in between. The object is to “…work together to build a shared picture with all the stakeholders that accurately represents what we “know,” what different people assert, what we can try and learn from, and what we currently think are the relevant options” (Seybold, 2013, pg. 5).

http://www.compendiumng.org/use-examples/

List of potential uses for CompendiumNG:

Continue:

Practice—Dialogue Mapping:

Dialogue Mapping “… has been used for over three decades to help the different stakeholders in large, complex projects achieve alignment, make decisions they can own, and move forward” (Seybold, 2013, pg. 1). It is related to other forms of argument mapping, for example the Toulmin Model of Argument (see for example, Intel, 2006), but uses an icon-based graphic organizer to denotes the parts of the argument, called Issue Based Information System (IBIS), “…a notation invented by Horst Rittel and Werner Kunz in the early 1970s. IBIS is best known for its use in dialogue mapping, a collaborative approach to tackling wicked problems (i.e. contentious issues) in organisations. “At the heart of IBIS’s power is the amazing capability of questions, when framed in an open and systematic way, to create new distinctions and new clarity out of the fog of social complexity and collapsed meanings,” says Patricia Seybold (2013, pg. 11). It has a range of other applications as well – capturing knowledge is a good example…” (Eight to Late, 2010). This article continues by quoting the first sentence of the abstract of Rittel & Kuntz (1970, pg. 1).

Issue—Based Information Systems (IBIS) are meant to support coordination and planning of political decision processes. IBIS guides the identification, structuring, and settling of issues raised by problem—solving groups, and provides information pertinent to the discourse.

IBIS was to be “…the type of information system meant to support the work of cooperatives like governmental or administrative agencies or committees, planning groups, etc., that are confronted with a problem complex in order to arrive at a plan for decision…” (pg. 1). It can be said, “From the start, then, IBIS was intended as a tool to facilitate a collaborative approach to solving …or better, managing a wicked problem by helping develop a shared perspective on it” (Eight to Late, 2010, pg. 2).

A Brief Introduction to IBIS (Source: Eight to Late, 2010)

The IBIS notation consists of the following three elements:

  1. Issues(or questions): these are issues that are being debated. Typically, issues are framed as questions on the lines of “What should we do about X?” where X is the issue that is of interest to a group. For example, in the case of a group of executives, X might be rapidly changing market condition whereas in the case of a group of IT people, X could be an ageing system that is hard to replace.
  2. Ideas(or positions): these are responses to questions. For example, one of the ideas of offered by the IT group above might be to replace the said system with a newer one. Typically the whole set of ideas that respond to an issue in a discussion represents the spectrum of participant perspectives on the issue.
  3. Arguments: these can be Pros (arguments for) or Cons (arguments against) an issue. The complete set of arguments that respond to an idea represents the multiplicity of viewpoints on it.

The Seven Question Types at the Heart of Issue Mapping (Source: Seybold, 2013, pg. 11):

  1. Deontic: What should we do?
  2. Instrumental: How should we do X?
  3. Criterial: What are the criteria for success?
  4. Factual: What is X?
  5. Conceptual: What does X mean?
  6. Explanatory: Why is X?
  7. Contextual: What is the background?

Issue Mapping can be used effectively for everyday business and personal decisions, but its potential is vast. Through the skillful use of questions, an issue map has unlimited capacity to represent and clarify diverse points of view, conflicting interpretations and goals, inconsistent information, and other forms of complexity…”
(Cognexus Institute website: www.cognexus.org/)

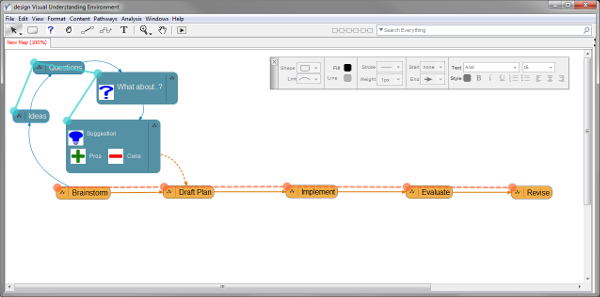
Compendium is a freeware tool that can be used to create IBIS maps… In Compendium, the IBIS elements described above are represented as nodes as shown in Figure 1: issues are represented by blue-green question marks; positions by yellow light bulbs; pros by green + signs and cons by red – signs. Compendium supports a few other node types, but these are not part of the core IBIS notation. Nodes can be linked only in ways specified by the IBIS grammar as I discuss next.

Figure 1: IBIS elements

The IBIS grammar can be summarized in three simple rules:

  1. Issues can be raised anew or can arise from other issues, positions or arguments. In other words, any IBIS element can be questioned. In Compendium notation: a question node can connect to any other IBIS node.
  2. Ideas can only respond to questions– i.e. in Compendium “light bulb” nodes can only link to question nodes. The arrow pointing from the idea to the question depicts the “responds to” relationship.
  3. Arguments can only be associated with ideas– i.e. in Compendium “+” and “–“ nodes can only link to “light bulb” nodes (with arrows pointing to the latter)

The “legal links” are summarized in Figure 2 below.


Figure 2: Legal links in IBIS

Yes, it’s as simple as that.

(pp. 2-3).

Facilitate Group Meetings Using Real-time Dialogue Mapping (Seybold, 2013, pg. 17-18).

The place that Dialogue Mapping really shines is in a face-to-face group design and/or strategic planning session. It’s a much richer tool to use than capturing ideas on flip charts. Don’t forget, however, that just displaying the flow of the conversation doesn’t really add a lot of value. Getting people to validate the ideas that are captured, to build on them, and to really own the map as an active part of their design process is where Dialogue Mapping really shines.

[…]

Continue to Evolve the Group Discussions/Maps Over Time

Today’s design activities are far from “one and done.” Usually you kick off a design project with a vague idea about the appropriate solution and, over time, through the shared dialogue, experimentation, and learning, you evolve your collective thinking and come up with better and better solutions through trial and error.

Asynchronous Mapping In Between Group Meetings. In between group meetings, participants can add to their section of a group map on their own time. They can add links and documents to the map as ammunition to bolster a pro or a con. They can add new ideas, along with sketches, text, or videos to provide really great examples for other team members to absorb at their own pace.

Capture Institutional Memory. One of the beauties of Dialogue Maps is that they can be time- and date-stamped and added to over time. You can then see a history of how your collective thinking evolved. Many of Jeff Conklin’s clients really value the institutional memory that these maps provide over a long period of time.

From Mapping project dialogues using IBIS – a case study and some reflections (Awati, 2011)

Abstract
Purpose
: This practice note describes the use of the IBIS (Issue-Based Information System) notation to map dialogues that occur in project meetings.

Design/methodology/approach: A case study is used to illustrate how the technique works. A discussion highlighting the key features, benefits and limitations of the method is also presented along with a comparison of IBIS to other, similar notations.

Findings: IBIS is seen to help groups focus on the issues at hand, bypassing or avoiding personal agendas, personality clashes and politics.

Practical Implications: The technique can help improve the quality of communication in projects meetings. The case study highlights how the notation can assist project teams in developing a consensus on contentious issues in a structured yet flexible way.

Originality / Value: IBIS has not been widely used in project management. This note illustrates its value in helping diverse stakeholders get to a shared understanding of the issues being discussed and a shared commitment to achieving them.

Action: Identify an interested working group to continue investigating applications of dialogue mapping [here at work].

Reference

Awati, Kailash (2011) “Mapping project dialogues using IBIS: a case study and some reflections”, International Journal of Managing Projects in Business, Vol. 4 Iss: 3, pp.498 – 511. [PDF]

Buckingham Shum, Simon; Selvin, A.M.; Sierhuis, Maarten; Conklin, Jeffrey; Haley, C.B. and Nuseibeh, Bashar (2006). Hypermedia support for argumentation-based rationale: 15 years on from gIBIS and QOC. In: Dutoit, A.; McCall, R.; Mistrik, I. and Paech, B. eds. Rationale Management in Software Engineering. Berlin: Springer-Verlag, pp. 111–132.

Eight to Late (WordPress blog: Archive for the ‘Issue Based Information System’ Category, (2010), https://eight2late.wordpress.com/category/issue-based-information-system/ .

Horst W. J. Rittel & Webber, Melvin M., Dilemmas in a General Theory of Planning (1973), Policy Sciences 4 (1973), 155-169.

Intel Corp. (2006) Teach To The Future, Showing Evidence Tool Resources, Appendices [PDF: www.schoolnet.org.za/twt/09/M9_argumentation.pdf]

Kunz, Werner and Rittel, Horst W. J., Issues As Elements Of Information Systems (1970) [PDF: www.cc.gatech.edu/~ellendo/rittel/rittel-issues.pdf].

Seybold, Patricia (2013), How to Address “Wicked Problems” Use Dialogue Mapping to Build a Shared Understanding and Evolve a Group’s Thinking, [PDF: http://dx.doi.org/10.1571/br05-23-13cc]

There are shortcomings in the notation and maps can get unwieldy. While it’s easy to get started, dialogue mapping requires considerable practice to perfect (Awati, 2011, pg. 14). These and some other factors have slowed adoption. Some of these factors certainly exist in my workplace. We’ll soon see if the apparent awakening to the existence of different strategies to build more effective communication gains enough momentum to catch on and spread.

§

May 20

Dynamic duo: delineating divergence with SimpleMind! & FreeMind

Image of a mind map created with Freemind.There are literally hundreds of mind mapping programs available. When I wrote about the need for 21st century collaborators to consider the ways divergent and linear thinking interact when planning and executing strategy, and suggested mind mapping software as an apt strategic planning tool, I said you can always place map nodes in a line if you want to be linear. I hadn’t yet discovered that there are mind mapping tools that will attempt to do this for you. It was the purchase of SimpleMind! for my iPhone that alerted me to the uniqueness of FreeMind.

Screenshot SimpleMind! app

SimpleMind! is available on the iTunes and Android stores.

SimpleMind! for iOS has the ability to send the map you create by email in a number of useful formats, including FreeMind (*.mm). I must admit, I had installed FreeMind and opened it only once. All I saw was what looked to me like an immature open-source interface1. But I never bothered to uninstall it, so when I checked off one of everything and clicked the .mm file SimpleMind! sent me, I really didn’t know what to expect. While on the subway, using SimpleMind! on my iPhone I sketched out a map of what “student-centred” might look like in the context of teacher education. The PDF is identical to what SimpleMind! showed on my iPhone. Hover over it, or tap-hold, to see the FreeMind version.

Student centred: student’s at centre of exactly what?

What opened looked like an attempt to take my multi linked mind map and convert it to a more linear display. The places where it failed were, by no coincidence as it turns out, parts of my map where I already questioned my links, or felt unsure of relationships. Seeing the more linear map actually helped me revise and improve upon my original idea.

Unfortunately there are connections I drew between nodes in SimpleMind! that didn’t translate to FreeMind2. I think this supports my idea that maps capture relationships that may challenge simple lists, but also that linear thinking can aid the divergent thinker by supplying order and focus. Linear thinkers can lose sight of the centre; divergents sometimes forget where to begin.

Download Freemind from SourceForge.
SimpleMind! is available for iOS and Android in a limited free version, upgradable at a very reasonable price.

The Visual Thinking Center

§

  1. Earlier this month I discovered XMind, a well-developed open source mind-mapper I might describe as ‘Freemind on steroids.’ I’ve already found it very effective for planning and then creating a static list for management. I hope to find time to blog it soon.
  2. XMind handles the worst of these shortcomings by noting the linked nodes “See also:”
Dec 21

Can (messy) mind maps enable tidy linear strategies within messy situations?

Graphic: a very messy mind map of a complex project.
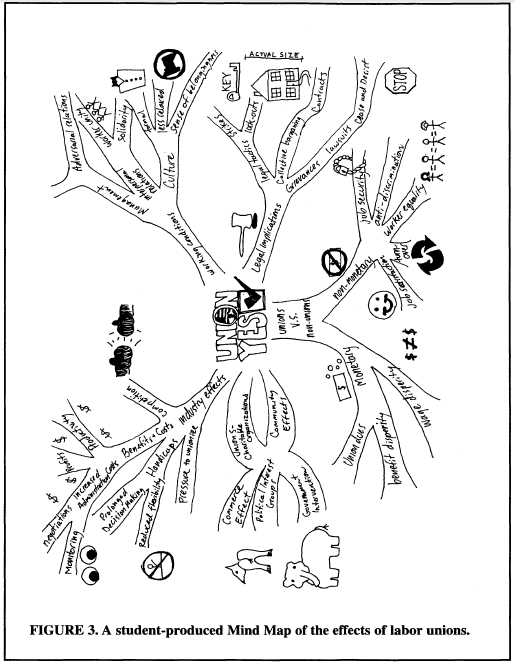
My research into educational, mostly open source software tools identified ones that have proven multi-tasking abilities within “authentic” learning situations (Conole and Fill, 2005; Conole, 2008). Among these, the so-called “Mind Mapping” tools stand out for what I think are several very good reasons. The image to the right, a “mind map” of a recent research project, shows the good, the bad and the ugly.

the rules common to all information systems do not cover the messy, ambiguous, and context-sensitive processes of meaning making, a form of activity in which the construction of highly “fuzzy” and metaphoric category systems is just as notable as the use of specifiable categories for sorting inputs in a way to yield comprehensible outputs.

—Jerome Bruner (1996 in Illeris, 2009, pg. 162)

It seems under-researched maybe, but I believe I saw indications, and I certainly have anecdotal evidence, that mind maps may lack meaning to people who for whatever reason(s) must solve problems in predominantly linear ways. In at least one case I’ve seen a mind map—the one of my research project at the top of the post—elicit genuine anxiety in a person with clinical anxiety disorder!

Messiness: the face of authentic learning

It’s certainly true that mind maps can get confusing. Connections become interwoven in admittedly “messy” ways—which, I argue, makes them particularly suitable to solving exactly the types of messy problems we increasingly face—although they often appear in ways that can understandably throw self-identified “linear thinkers” quite literally for a loop. It’s small wonder many people believe mind maps don’t, won’t, will never work for them. However, the same solutions cartographers have applied for centuries work in these maps too (Buckingham Shum and Okada, 2007), and are available in free tools with powerful multitasking abilities. Messiness is a fact of authentic learning situations (Collins, Joseph & Bielaczyc, 2004, pg. 19). Clinical settings and attempts to eliminate messiness can even be counter-productive (pg. 20). Describing the linear step pattern shown below in Fig. 1 (red line) Patricia Seybold says, “…we keep trying to shoehorn” Wicked Problems into that linear approach” (2013, pg. 3). I think what I’ll call linear imposition, the imposing of a linear framework or template on a non-linear situation, is at the root of Jean Lave’s “paradox” she says often causes institutionalized learning to fail (Lave, 1993, pg. 78). I believe ethnographers such as Lave have had an important impact on design thinking in education research and instructional design because of their “attempts to characterize relationships and events that occur in different educational settings. …ethnographic research produces rich descriptions that make it possible to understand what is happening and why” (Collins, Joseph & Bielaczyc, 2004, pg. 21). By “rich” descriptions Collins, Joseph & Bielaczyc mean “‘Thick,’ as in Geertz,” and by mapping these connections we contribute to the design of ‘thicker’ learning situations we hope result in deeper learning.

designVUE: lining up the non-linear

The problem is, while we may place things on lists and in lines to organize and sequence an approach, those things may have their own interconnections and internal organizations, especially if the “things” are groups of people with competing rights and interests. And so the line we draw prior to achieving full understanding of a problem is actually an imposition that changes the nature of the existing problem and causes new problems to arise. As Conklin has shown, solving problems is an iterative process.

How Humans Solve Opportunity-Driven Problems

graph plotting a linear step by step solution (red) overlayed by a process actually observed in practice (green)

Figure 1: From a 1980’s study at the Microelectronics and Computer Technology Corporation (MCC) that looked into how people solve problems. Each peak in the green line can be understood as heading “back to the drawing board,” yet each return to the drawing board carries all the experience of the previous attempts. Source: Conklin, 2006 ©2006 John Wiley & Sons, 2013 CogNexus Group. For an excellent discussion, see also Seybold, 2013.

Mitigating Mind-Map Anxiety

Mind-map anxiety might be mitigated by applying well understood principles of cartography. Buckingham Shum and Okada (2007) say the analogy to cartographic representations of physical space is valid, providing “…an ‘aerial view’ of a topic by highlighting key elements and connections,” and calling mind maps “vehicles for summarising and negotiating meaning” (pg. 27). designVUE is one college design department’s enhancement of another university’s contribution to the open source software world and visual understanding. I think designVUE’s quick formatting tools and presentation mode lets us do some of the things map makers do. Some of these things are, or should be, in grade-level curriculum requirements—perhaps giving students hands on access to free tools like designVUE might support the teaching and learning of many.

Map coloring is the act of assigning different colors to different features on a map. There are two very different uses of this term. The first is in cartography, choosing the colors to be used when producing a map. The second is in mathematics, where the problem is to determine the minimum number of colors needed to color a map so that no two adjacent features have the same color.
—Wikipedia article

There’s nothing more linear than a time-line; as the first image shows, a mind-mapping tool makes it easy to display linear progression, so if this is the only objection, it soon crumbles. In designVUE you choose the colour scheme (“fill,” “line,” font “style”) and shape.

With the Quick Prototyping tool draw a line of bubbles in a quick succession of clicks…

mind map bubbles in a line

Image 1. In VUE you can use the Prototyping tool to draw a line of bubbles with a directional arrow between, or with standard tool place the thought bubble on a line or arrow.

Any individual “bubble” in the map may consist of much messier activities. Brainstorming, for example, is a spiral of ideas, questions, answers, and arguments. In designVUE you can use colour to visually set an activity apart, but you can also create pathways that hide and reveal specific sets of bubbles—overcome cognitive overload. Or group bubbles within each other as I’ve done here with a question, answer and pro/con set that illustrate IBIS1, a system that often goes hand-in-hand another highly successful application of mind-maps: “dialogue mapping2.”

mind map bubbles of a new color added in a spiral

Image 2. Part of a brainstorming session suggesting a circular and iterative process, shown in a different colour. With “Pathways” you can hide entire sections and choose different sequences.

But wait! Yes, there’s more! In these days of collaboration linear thinkers and their strategies are as important as ever. designVUE has a presentation tool that allows teams to construct linear pathways through maps of even the most complex dialogues, in order to gain clarity, reach consensus, and explain decisions to others. designVUE also does metadata in OpenCalais, allows you to store resources and documents in the bubbles, share maps as interactive HTML documents, reuse the same maps in multiple other maps… I’m only scratching the surface.

Image 3. Showing Pathways in the workspace. Also shown are the IBIS icons for question, idea, pro and con arguments.

The Pathways panel allows you to create standard (linear) PowerPoint-like slides and bullet points, though not as effortlessly as the commercial product. VUE’s true power as a presentation tool takes some time to appreciate and master, but if your goal is to enhance a learning situation by creating memorable and meaningful visual connections between the content, and then using the same tool to convey those ideas to an audience this tool might be what you’re after.

mind map bubbles of a new color added in a spiral

Image 4. The Pathways panel allows you to show and edit more traditional PowerPoint-like slides. In effect VUE’s “Pathways” can be separate but related presentations, or audience-specific variations on a theme.

Panel closeup. The images can be sized, additional ones and text added to each slide that need not be shown in other views:

Image 5. Closeup of the expanded Pathways Panel. The order and whether it’s shown is determined here.

In Presentation mode, hitting Enter can shift to yet another view of the groups of ideas in the presentation. There’s definitely a learning curve but my early impression is this can potentially change the way you do presentations. I highly recommend this VUE tutorial for ideas and examples.

Image 6. In Presentation mode, hitting Enter can shift to yet another view of the groups of ideas in the presentation. See this VUE tutorial for examples (note the PDF for download beneath the video player).

Summary

The types of 21st century problems we increasingly understand need taming—as they defy solving by their very nature—are “wicked problems.” This necessarily includes nearly all matters of public education, indeed of public policy as a whole, where the conflicting and intersecting rights and responsibilities of multiple stakeholders is always …messy! Governments are coming to recognize this. See the Australian Public Service Commission site for one well explained example (Commonwealth of Australia, 2007). In Canada Quebec and New Brunswick have already discovered the importance of understanding certain problems’ ‘wickedness’ in these ways. “As distinguished from problems in the natural sciences, which are definable and separable and may have solutions that are findable, the problems of governmental planning—and especially those of social or policy planning—are ill-defined; and they rely upon elusive political judgement for resolution. (Not “solution.” Social problems are never solved. At best they are only re-solved—over and over again.)” (Rittel and Webber, 1973, pg. 160).

Mind mapping, undertaken thoughtfully and with purpose (see Jeff Conklin’s video: The Limits of Conversational Structure), has proven its value in all aspects of teaching and learning. As a teacher I used it much as John Budd did here, and as an instructional designer I use it as a graphic organizer. When mapping strategies are used to both record, and then map dialog to describe real situation, and when that’s done openly and collaboratively as in situations such as Conklin has described and reproduced in practice for years it can lead to shared understanding and conflict resolution.

I don’t think it’s fair, or rational, to presume that everyone is going to instantly drop PowerPoint and buy into a mindmap-based workflow, and that’s not what I’m suggesting. While dialogue mapping can handle wicked problems, it can also do meeting minutes, so consensus can be achieved and documented by the most mutually comfortable and practical means—and the cartographers have a single one stop tool to gather and document the entire process, or to communicate it to others.

Conlusion

If we embrace all the 21st century models, or “competencies” seen emerging, the primary and inescapable one at the base of many others is asynchronous collaboration via digital networks. Can it not simply be that the divergent thinkers map their thoughts in collaboration with linear thinkers who further delineate the why and how of their musings? Taking up perhaps the next most agreed upon 21st century learning objective, critical thinking, it seems likely we can seek solutions to simple problems and taming strategies for wicked ones, discerning the difference. Mind mapping tools are web enabled and metadata ready. A strategy for taming wicked problems that uses mind maps, argument mapping or Conklin’s trademarked Dialogue Mapping, keeps track of pros, cons, and rationale, and documents decisions making around simple problems, but offers a powerful tool for the building of the shared understanding that must precede consensus around the taming of wicked ones. Formal training can be found, but the VUE, designVUE and various Compendium software sites themselves, Conklin’s and YouTube are probably the place to start—to get an, ahem… visual understanding of what mind maps and mind mappers might bring to which ever debate you’re having.

Maybe “Can messy mind maps enable tidy linear strategies within messy situations?” isn’t the right question. In my experience it still requires steps and sequencing to deal with the issues, but the graphic organization—the visual understanding—provided by maps in programs like VUE and Compendium, in the right hands, can really help you get a grip on the situation. It very well may need both types of thinking, and that well may require collaboration. Maybe the question to be asking is, “Are there any concept and conversation cartographers in your workplace or your PLN?”

§

Read more about mind maps


    Notes:

  1. Issue-Based Information System (IBIS) was invented by Werner Kunz and Horst Rittel as an argumentation-based approach to tackling wicked problems – complex, ill-defined problems that involve multiple stakeholders. (more)
  2. Dialogue Mapping™ is trademarked by Jeff Conklin & CogNexus Institute, who describes it as “…a radically inclusive facilitation process that creates a diagram or ‘map’ that captures and connects participants’ comments as a meeting conversation unfolds. It is especially effective with highly complex or “Wicked” problems that are wrought with both social and technical complexity, as well as a sometimes maddening inability to move forward in a meaningful and cost effective way.” (more) [Demonstration PDF]

§

the assumptions proposed here amount to a preliminary account of what is meant by situated learning. Knowledgeability is routinely in a state of change rather than stasis, in the medium of socially, culturally, and historically ongoing systems of activity, involving people who are related in multiple and heterogeneous ways, whose social locations, interests, reasons, and subjective possibilities are different, and who improvise struggles in situated ways with each other over the value of particular definitions of the situation, in both immediate and comprehensive terms, and for whom the production of failure is as much a part of routine collective activity as the production of average, ordinary knowledgeability.
—Jean Lave

More VUE

The Visual Understanding Environment (VUE) is an Open Source project based at Tufts University

VUE is very well documented. The English user guide is here.

designVUE is a branch of VUE. It is an open source project based in the Design Engineering Group of the Mechanical Engineering Department at Imperial College London.

CompendiumLD is either fierce competition… or you can do as I do and use both! See the Learning Design-specific “stencils” in the screen shots. They’re easily ported to other Compendium flavours, and you could apply the concept in VUE with your own icons and very little extra trouble.

Reference

Bruner, Jerome (1996) Culture, mind, and education in Contemporary Theories of Learning – Learning theorists … in their own words, Knud Illeris ed., 2009, NY: Routledge; Edition published in the Taylor & Francis e-Library, 2009.

Buckingham Shum, Simon and Okada, Alexandra (2007). Knowledge Mapping for Open Sensemaking Communities. In: Researching open content in education – OpenLearn 2007, 31 Oct 2007, Milton Keynes, UK.

Collins, Allan & Joseph, Diana & Bielaczyc, Katerine (2004), Design Research- Theoretical and Methodological Issues, The Journal of the Learning Sciences, Vol. 13, No. 1, Design-Based Research:Clarifying the Terms. Introduction to the Learning Sciences Methodology Strand (2004), pp.15-42

Commonwealth of Australia (2007) Tackling Wicked Problems: A Public Policy Perspective, [Archived]

Conklin, Jeffrey (2006) Dialogue Mapping: Building Shared Understanding of Wicked Problems, West Sussex: John Wiley & Sons., Ltd., 242 pp.

Conklin, Jeff (2006b) Dialogue Mapping Demonstration, [unspecified journal, citation incomplete] CogNexus Institute, pp. 249-251 [Demonstration PDF].

Conole, G. and Fill, K. (2005). A learning design toolkit to create pedagogically effective learning activities Journal of Interactive Media in Education 2005(08). [PDF: jime.open.ac.uk/2005/08]. Gráinne Conole and Karen Fill, University of Southampton. Page 1 Published 26 September 2005 ISSN: 1365-893X [uses CompendiumLD]

Conole, G. (2008). Capturing Practice: The Role of Mediating Artefacts in Learning Design. Handbook of Research on Learning Design and Learning Objects. (Eds.) Lockyer, L., Bennett, S., Agostinho, S. and Harper, B. ISR Press. [Pre-print of learning design chapter on using compendium].

Lave, J., & Wenger, E. (1991). Situated learning. Legitimate peripheral participation. Cambridge, England: Cambridge University Press.

Lave, Jean (1993) The practice of learning in Contemporary Theories of Learning – Learning theorists … in their own words, Knud Illeris ed., 2009, NY: Routledge; Edition published in the Taylor & Francis e-Library, 2009.

National Collaborating Centre for Healthy Public Policy (2012) Tackling Wicked Problems in the Built Environment: Of Health Inequalities and Bedbugs [Workshop details]

Rittel, Horst and Melvin Webber (1973) “Dilemmas in a General Theory of Planning,” Policy Sciences 4, Elsevier Scientific Publishing, Amsterdam, pp. 155-169.

^ Seybold, Patricia B. (2013) How To Address “Wicked Problems” – Use Dialogue Mapping to Build a Shared Understanding and Evolve a Group’s Thinking, book review, [HTML | PDF]

May 20

Visual Understanding Environment (VUE) as a presentation tool

VUE, and its design-centric extension, designVUE, are concept-mapping tools with rather extraordinary superpowers. In fact if you think they look like simple tools for making mind-maps I’m here to nudge you to take a closer look. Mind map being created in VUE.

Metadata

Does quickly and invisibly making your content “more accessible, interoperable and valuable” sound good? Have you heard of “…Web 3.0, the Semantic Web or the Giant Global Graph…?” These two well-connected apps support OpenCalais and other meta-data helpers.

While the VUE site is essential for resources and documentation, I recommend installing and using designVUE. Even if you don’t use IBIS argumentation, what they refer to as “bi-directional hyperlinking between files,” known elsewhere in designVUE as “wormholes” (and in Compendium as “transclusion,”) or the ability to place one map within another, is a powerful ability that separates tools like VUE and Compendium from the plethora of mind mapping tools available.

Presentation tool

That’s what I’m learning first—the built-in presentation tool. There’s not much more I can add about it at this point than what’s in this rather comprehensive overview/tutorial (more overview than tutorial, maybe?), so with no further ado…

Next

I seem to be able to screen record these presentations with another open source program, so if that pans out I’ll share it then. I think it’ll definitely take some practice thinking about presenting in a different way, but there’s a great deal of evidence that idea maps, visually connecting the dots, and the activities such as argument mapping that are associated with them a) may have a natural fit with social networks and social learning, and b) organize data in ways consistent with the human brain (see for example Conole & Fill, 2005 and its extensive reference list).

§

More

The Visual Understanding Environment (VUE) is an Open Source project based at Tufts University

designVUE is a branch of VUE. It is an open source project based in the Design Engineering Group of the Mechanical Engineering Department at Imperial College London.

Conole, G. and Fill, K. (2005). A learning design toolkit to create pedagogically effective learning activities Journal of Interactive Media in Education 2005(08). [PDF: jime.open.ac.uk/2005/08]. Gráinne Conole and Karen Fill, University of Southampton. Page 1 Published 26 September 2005 ISSN: 1365-893X

Calais Marmoset is a simple yet powerful tool that makes it easy for you to generate and embed metadata in your content in preparation for Yahoo! Search’s new open developer platform, SearchMonkey, as well as other metacrawlers and semantic applications.

Feb 19

Design Learning, Learning Design

In 1981 “cognitive apprenticeship” was a nascent framework proposed by early researchers with an eye on computer-assisted design of computer-enhanced learning environments that are “situated.” This means “authentic”

The research on the tailors did not result immediately or even very soon in an alternative to the theory for which it offered a critique. It did impel me to go looking for ways to conceptualize learning differently, encouraged by those three interconnected transformations that resulted from the project: (1) a reversal of the polar values assumed to reflect differing educational power for schooling and “other” forms of education; (2) a reversal in perspective so that the vital focus of research on learning shifted from transmitters, teachers or care givers, to learners; and (3) a view of learning as socially situated activity. This work couldn’t replace existing theories, but it provided incentives to ask new questions about learning.
—Jean Lave (1996:155)

activities taking place in the context of, and with the full support of, a “community of practice.” In general the other participants are—for the time being—more proficient than the learner at the given craft or activity. Learners and practitioners interact in a wide variety of ways, often over considerable time, that can be characterized as strategies or phases—observing and practising, receiving scaffolded (progressively adapted by the practitioners) coaching until working independently. The overly-theoretical sounding name has mostly gone by the wayside, but the concepts and application have matured. Still employing ethnography to gather thick qualitative descriptions, there’s now stronger input from the fields of design and architecture. The new name is “Design Learning.” I see parallels in research into tool redesign conducted at Open University NE and Open University UK.

“computers … can make the invisible visible … they can make tacit knowledge explicit … to the degree that we can develop good process models of expert performance, we can embed these in technology, where they can be observed over and over for different details” (p. 125).
Allan Collins, 1991:125

In 1992 Allan Collins and Ann Brown built on their earlier research (e.g., Collins, Brown, and Newman, 1989; Collins, Brown, Holum, Duguid, 1989; Collins, Brown, Holum, 1991) and conducted what they dubbed design experiments.; “Design experiments were developed as a way to carry out formative research to test and refine educational designs based on principles derived from prior research,” i.e., cognitive apprenticeship. There is a direct line from the Cognitive Apprenticeship Framework to Design Learning, (Collins et al., 2004) and recent experiments in the redesign of learning design tools (Conole et al., 2007) (LAMS, 2008) (OULDI-JISC, 2012).

They built on the work of Herbert Simon (1969) who regarded the “design sciences,” such as architecture, engineering, computer science, medicine, and education, as the “sciences of the artificial,” that have been neglected because of the lack of rigorous theories. John Seely Brown and and David Kearns co-founded the Institute for Research on Learning (IRL) in 1986 and adopted ethnography—the description of peoples’ customs and cultures—as its main research method. The Institute forged new understandings of how individuals enter and join learning communities, achieve acceptance, then themselves grow and evolve as vessels of community knowledge. As they do so they often increase interaction and engagement—i.e., collaboration—with secondary networks outside their primary one (Lave & Wenger, 1991) (Lave, 1996). Does it sound just a bit like joining Twitter?

Ethnography attempts “thick descriptions” in the style of Geertz. One of the more fundamental truths of pedagogy spotlighted by this approach is its “messy” and iterative nature. The motto of instructors and learners alike may be “If at first you don’t succeed, try, try again,” but it’s always with an eye toward improving on previous attempts.

Case studies are touted by a wide assortment of education stakeholders. They are used up front in planning, as course content, or as summary program assessment. A good case study can be a thick, descriptive ethnography of a situation.

By studying a design in practice with an eye toward progressive refinement, it is possible to develop more robust designs over time. […] Ethnography provides qualitative methods for looking carefully at how a design plays out in practice, and how social and contextual variables interact with cognitive variables. […] Design experiments are contextualized in educational settings, but with a focus on generalizing from those settings to guide the design process”
(Collins, Joseph, & Bielaczyc, 2004).

The Open University Learning Design Initiative have been working across several OU faculties and with 4 other universities to pilot curriculum design activities, identify and develop tools, and otherwise contribute to academic and practitioner research. If you’ve followed my Tweets or blog the past several weeks you’ve already heard of CompendiumLD. Follow the link to see more tools and other output from this prolific group.

All told these and associated authors (see also Conole, 2007, Conole et al., 2008) consulted close to 50 case studies, but they did not fall into a common pitfall of well-read academics: the automatic presumption of expertise. On the contrary, they embrace the messiness as evidence of authenticity and opportunity for iterative improvement. “The concept of a ‘learning design methodology’ has been integral …however, different readings of the term could, and were, made. …resisting a single definition has enabled us to connect more readily with diverse literatures and to orientate resources and tools towards user needs.” (OULDI-JISC, 2012)

I think that’s academic for, “There are no mistakes, only opportunities.” (—Tina Fey?)

Case studies and design experiments allowed these and other researchers to, among other things, map tools and strategies to the six instructional methods of cognitive apprenticeship and to develop a Scaffolding Design Framework to focus its use.


§


Reference

Brown, J. S., Collins, A., & Duguid, P. (1989). Situated cognition and the culture of learning. Educational Researcher, 18 (1), 32-41.

Collins, A., Brown, J. S., & Newman, S.E. (1989). Cognitive apprenticeship: Teaching the crafts of reading, writing, and mathematics. In L. B. Resnick (Ed.), Knowing, Learning and Instruction: Essays in Honor of Robert Glaser (pp.453- 494). Hillsdale, NJ: Lawrence Erlbaum Associates.

Collins, Allan; Brown, John Seely; and Holum, Ann (1991). Cognitive apprenticeship: Making thinking visible. American Educator: The Professional Journal of the American Federation of Teachers, 15(3), 6-11, 38-46, [reprint available on line at http://elc.fhda.edu/transform/resources/collins_brown_holum_1991.pdf (PDF) accessed 2012-09-17] or from The 21st Century Learning Initiative http://www.21learn.org/archive/cognitive-apprenticeship-making-thinking-visible/ (HTML), accessed 2013-02-19.

Collins, Allan; Joseph, Diana and Bielaczyc, Katerine (2004). Design Research: Theoretical and Methodological Issues, The Journal of the Learning Sciences, 13(1), 15-42.

Conole, G. (2007), ‘Describing learning activities: tools and resources to guide practice’ in Rethinking pedagogy for a digital age, H. Beetham and R. Sharpe (Eds), Oxford: RoutledgeFalmer.

Conole, G. (2008), ‘Capturing practice: the role of mediating artefacts in learning design’, in L. Lockyer, S. Bennett, S. Agostinho, and B. Harper (Eds), Handbook of Research on Learning Design and Learning Objects: Issues, Applications and Technologies.

Ghefaili, Aziz (2003). Cognitive Apprenticeship, Technology, and the Contextualization of Learning Environments, Journal of Educational Computing, Design & Online learning Volume 4, Fall, pp 1-27.

Geertz, Clifford (1973) Thick Description: Toward an Interpretive Theory of Culture, pp. 3-30, in The Interpretation of Cultures: Selected Essays, NY: Basic Books, 470 pages.

OULDI-JISC (2012) Cross, Simon; Galley, Rebecca; Brasher, Andrew & Weller, Martin, Final Project Report of the OULDI-JISC Project: Challenge and Change in Curriculum Design Process, Communities, Visualisation and Practice, Institute of Educational Technology The Open University, July 2012, www.jisc.ac.uk/media/documents/programmes/curriculumdesign/OULDI_Final_Report_instit%20story.pdf.

Simon, H. A. (1969) The sciences of the artificial. Cambridge, MA: MIT Press.

Dec 13

Mind mapping, concept mapping—making the relationships between ideas visible

In his 2004 article published in The Journal of Economic Education John Budd describes an in-class exercise “…in which small groups of students each create a Mind Map for a specific topic.” He says creating mind maps is “…an example of an active and collaborative learning tool that instructors can use to move beyond “chalk and talk” …and incorporate diverse learning styles.” The author presents ideas for mind map topics for a wide variety of economics courses, and several lovely examples of students’ maps, drawn freehand and collaboratively. “hierarchies and associations flow out from a central image in a free-flowing, yet organized and coherent, manner.”Mind Maps can be lesson planners, lesson plans, and lessonsFirst page of article, Budd (2004)  about Mind Maps

There is now a good selection of mind- or concept-mapping software educational experience designers may find very helpful in making thinking visible, by offering ways to illustrate the connections between ideas. Nearly all of them are built for Internet collaboration. My goal in this post is just to share an inkling I’ve been getting that such software can find a role in lesson planning, lesson plans, and as John Budd and others have found, in the lessons themselves.

I wrote about one such program, Compendium, back in March, and I’ve tried my hand at mapping an understanding of cognitive apprenticeship. First I simply listed the pieces of the Collins, Brown and Holum (1991) framework, assigning symbolic icons to imply their role, positioning them visually so as to reflect their hierarchy. Then I use colour-coded arrows to indicate relationships between them. In the software these objects can all be opened as dialog boxes, which can store further details. “Mouseover” or “rollover” effects (anything the software does in response to a user placing their mouse pointer over something on the screen) let you peek inside.

UPDATE: I learned 2012-12-15 in Compendium Institute Newsgroup Digest #1389, that Compendium will receive a long overdue overhaul, and the source code seems to be finding its way to more friendly repositories. This recording of a Compendium developer meeting contains details, and may also be of interest to see how Compendium is used to add idea-mapping to the task of recording minutes. The recorded meeting demonstrates another technology-based approach to making thinking visible (and audible).

attempted Mind Map of cognitive apprenticeship

Fig. 1—Mapping the Cognitive Apprenticeship Framework
Trying to cover all the bases: making thinking visible while designing a lesson. Icons, positioning, colours, arrowhead direction have meaning, follow the designer’s logic… (cont…)

Two close-ups of the maps within (neither completed):

Map of Sociology of a learning experience

Fig. 2— Sociology
…general priorities and strategies unfold: coloured arrows illustrate relationships to and betweenthe ideas; each item can become a map of future brainstorming. Big questions asked here, “Have I planned for this?” “Who are my experts?” get deep answers at the next level…  (cont…)

compendium mind map

Fig. 3—Content
…where you can be clear and specific about content, methods, and activities. Compendium and similar software let you add lists, links, video, documents, and to publish the results.

These maps list the parts of the framework. In Compendium you can draw additional items as you brainstorm and you can put terms “inside” other items, for example double-click the Content->Questions icon and find the actual questions stored inside. You can label the lines, change the directions of the arrowheads or put arrowheads on both ends. You can also export an interactive version in HTML [also here and here] and other formats.

Wikipedia has a list of free and proprietary mind-map and idea mapping software. I’d like to try it all at some point but thus far I looked at “VUE,” or Visual Understanding Environment, a project at Tufts University. I found it to be very intuitive, it has a large and versatile set of features, produces a result similar in many ways to that of Compendium, and it can be used as a unique and powerful presentation tool. Also like Compendium they have a user community and a gallery that will tell you far more than I possibly can.

Budd points out some very significant differences between the mind map and the traditional, linear outline and states these have powerful implications for learning:

…note that each branch is captured by a single key word, not a phrase or sentence. Using single words reduces ideas to their core. Important ideas are not obscured by extraneous words, and new associations are not limited by more specific phrases. …The central point in the Mind Map must always be an image because the brain is drawn to an image more …differences in the size of the branches and the associated words are used to reinforce associations and to add emphasis. …the use of color is important in creating Mind Maps. …many Mind Maps use one color for each major category to aid in organization. …These differences can make Mind Maps powerful tools. …Research on memory and learning emphasizes the importance of associations, and the radiant structure of a Mind Map with explicit branches promotes associations. The use of color for different categories can also make more powerful associations. The use of emphasis in a Mind Map, for example with thicker main branches and larger printing, can also help the recall of information. The focus on using single key words can foster more expansive connections, and confining the entire Mind Map to a single piece of paper allows one to see the entire picture at once and perhaps stimulate additional associations.
(Budd, 2004:37-8)

Student-produced Effects of Labor Unions

Budd (2004) fig. 3 Student-produced Effects of Labor Unions

I should note that John Budd’s article is accompanied by samples of hand-drawn maps that, in my opinion, also reveal how far technology still has to go to match humans’ capacity for expression. Neither Compendium, nor from what I’ve seen so far VUE, has the ability to vary the width of connecting arrows, let alone supply the “branches” of a map with bark [n.b. Since first writing that sentence I’ve seen many others that do thicknesses (still no bark). See “Vic’s list” at the end of this post]. Educators can do much to influence the design of software by engaging directly with software developers and designers on social networks like Twitter. You do not need software to use mind maps in lesson plans.

Mind Maps can be used to add active and collaborative learning to courses. Students are engaged in active learning as they wrestle with ideas, associations, and categories in creating a Mind Map-they are creating their own Mind Map, not simply looking at one created by the instructor. The exercise is collaborative because the Mind Maps are created as a small group effort. A collaborative relationship between the instructor and students can also be established as the instructor helps with the constructions of the Mind Maps, but as a “guide on the side” not as the “sage on the stage” (Budd, 2004:42).

Because of the reliance on hierarchies, says Budd, concepts or classroom exercises that do not fit traditional outline structure are probably not good candidates for the creation of a mind map. Even in early explorations of collaborative concept mapping software I’ve noticed, in forum discussions and newsletters, a common motif that points to another criticism: mappers often say things like “this works for me” while maybe the internal logic isn’t quite as apparent to everyone. I believe such criticism can be overcome by perseverance, collaboration and openness to feedback.

I’ve experimented using Compendium to take notes in meetings, for sorting research, choosing between possible software solutions, and for planning (Conole & Fill, 2005). I’m now very interested in presentations using VUE. When it comes to mind mapping software I now often find myself saying, “This works for me.”

SOFTWARE SITES, in their own words:

The Compendium Institute (Open University and others) is an open forum for the ongoing development and dissemination of the Compendium methodology and software tools. Compendium is about sharing ideas, creating artifacts, making things together, and breaking down the boundaries between dialogue, artifact, knowledge, and data. http://compendium.open.ac.uk/institute/

The Visual Understanding Environment (VUE) is an Open Source project based at Tufts University. The VUE project is focused on creating flexible tools for managing and integrating digital resources in support of teaching, learning and research. VUE provides a flexible visual environment for structuring, presenting, and sharing digital information. https://vue.tufts.edu/

What surely must be the definitive list, “Vic’s compendium of software that supports knowledge management and information organisation in graphical form. Includes mind mappers, concept mappers, outliners, hierarchical organisers, KM support and knowledge browsers, 2D and 3D.” http://www.mind-mapping.org/

§


Reference

Budd, John W., (2004) Mind Maps as Classroom Exercises, The Journal of Economic Education, Vol. 35, No. 1 (Winter, 2004), pp. 35-46. [Available on line but missing accompanying graphics
www.legacy-irc.csom.umn.edu/faculty/jbudd/mindmaps/mindmaps.pdf, retrieved 2012-12-10]

Cognexus.org, recorded meeting 2012-12-12, Compendium Developer meeting, http://www.cognexus.org/Compendium_Futures/2012-12-12_C_Developer_Meeting.wmv, retrieved 2012-12-16.

Collins, A., Brown, J.S., and Holum, Ann (1991), Cognitive Apprenticeship: Making Thinking Visible, American Educator, [1991 reprint available on line at http://elc.fhda.edu/transform/resources/collins_brown_holum_1991.pdf accessed 2012-09-17].

Conole, G. and Fill, K. (2005), A learning design toolkit to create pedagogically effective learning activities, Journal of Interactive Media in Education 2005(08). [jime.open.ac.uk/2005/08].

McLeod, S. A. (2010). Kolb, The Learning Style Inventory. Retrieved from http://www.simplypsychology.org/learning-kolb.html 2012-12-03

Multimedia Learning by Richard E. Mayer (2009)