Aug 31

Case Method — classroom catalysts, from story to discourse and back again

Dis′ • course
1. spoken or written language, including literary works; the four traditionally classified modes of discourse are description, exposition, narration, and persuasion.
2. a form of discourse analysis, focusing on power relationships in society as expressed through language and practices.

One of the more interesting graduate courses I ever took, by way of both content and teaching style, was Current Policy Issues in Ontario Schooling. It was designed by the late R. Patrick Solomon but due to his tragic and untimely demise from cancer it was taught by his Brave New Teachers co-author John P. Portelli, at York University in the winter of 2010. Every class began using another of John’s books, What To Do? Case Studies for Educators 3d. Edition. It’s a collection of true stories from the classroom, either with an unknown outcome, or maybe a controversial but open ended one. Our job was to place ourselves in the classroom and reflect on what we might do in the same situation. Each “study” comes with 2 discussion questions at the end. We had no problem contributing additional ones of our own, and there are appendices containing further reading and resources for critical inquiry.

Case method

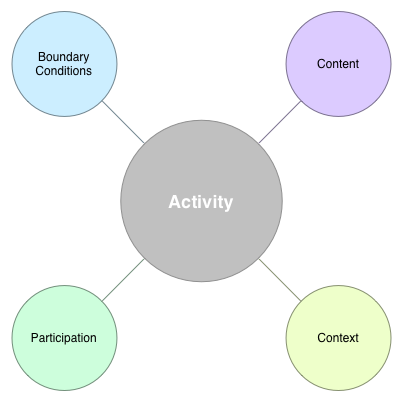
…curriculum reform focused on the effective negotiation of learning experiences between students and teachers and centred on the former’s concerns affords the opportunity for students to reengage in a creative, meaningful education where they are co-constructors of knowledge with their teachers in a genuine learning organisation.
O’Grady, O’ Reilly, Portelli, and Beal (2014)

Image of the book cover
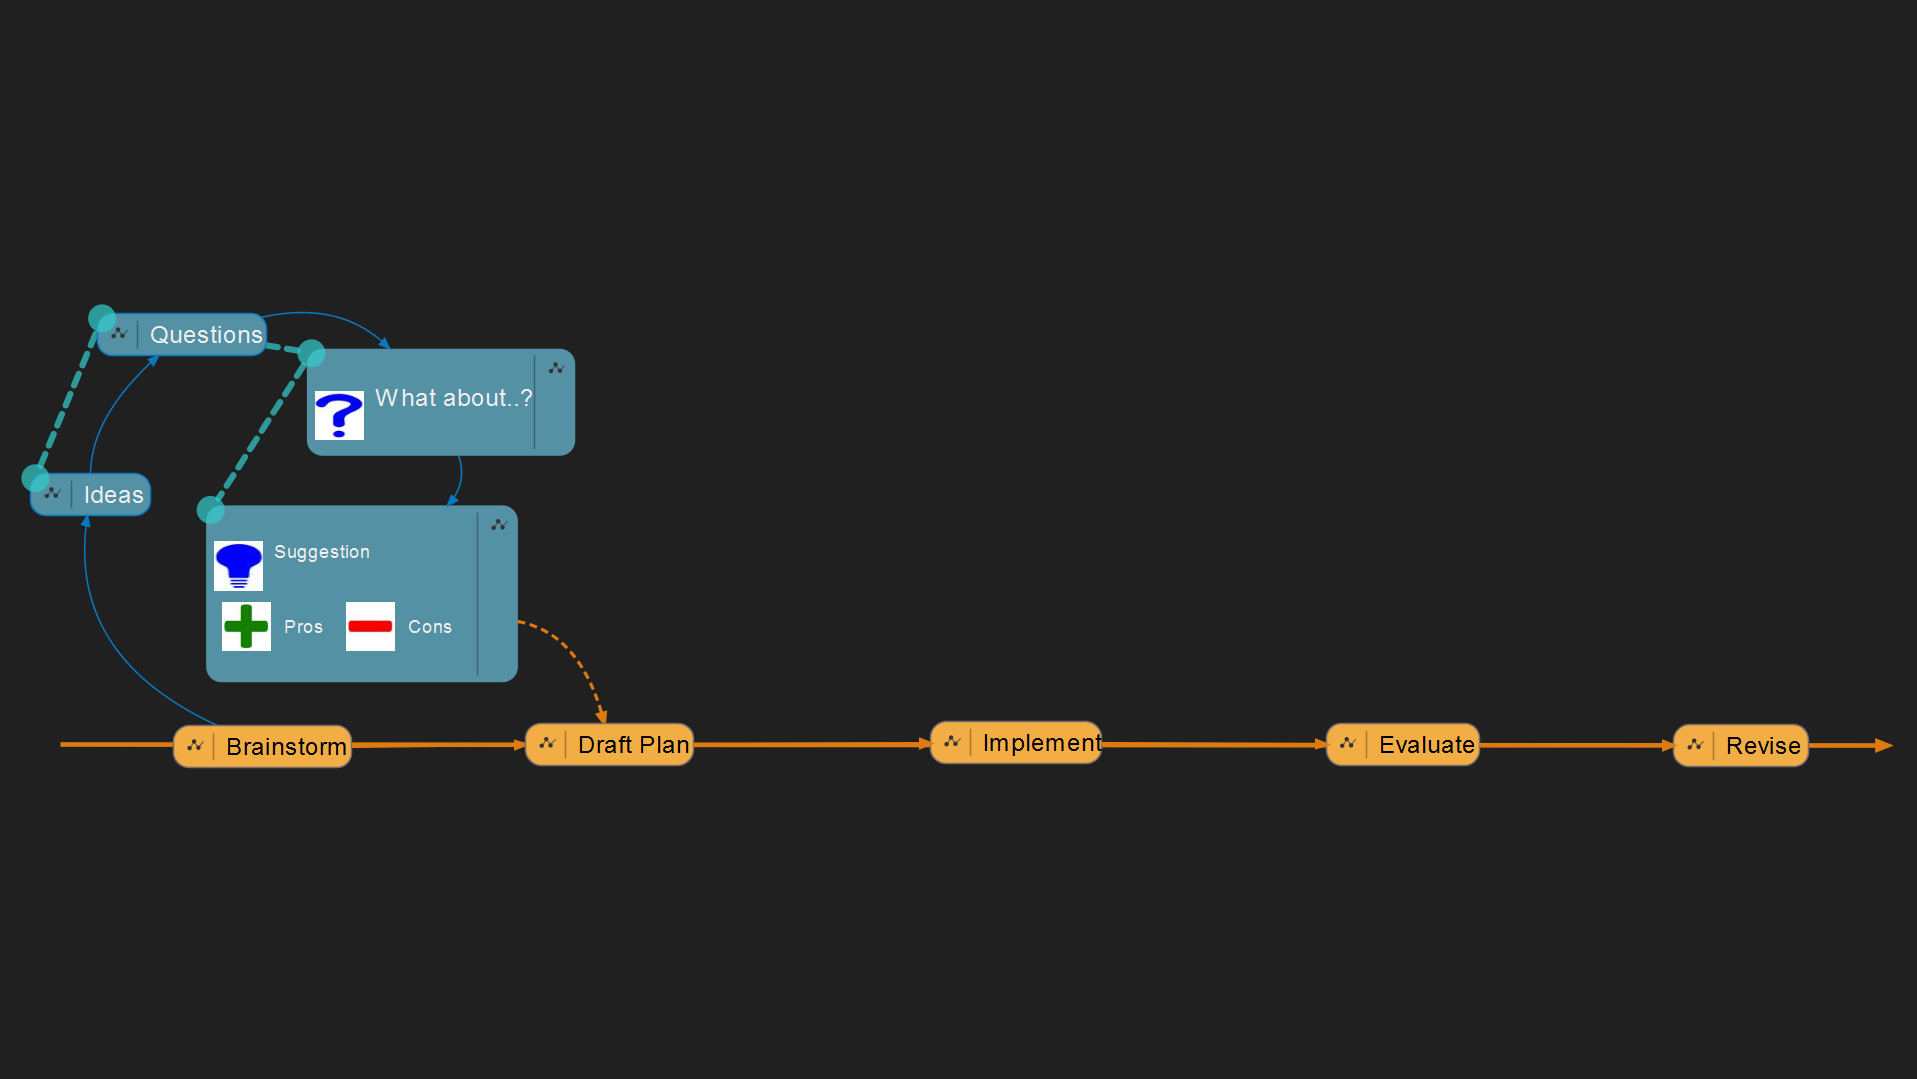
Case method is the use of case studies as catalysts for conversation. The case poses a dilemma or problem, and the group must collaborate finding solutions. There’s ample evidence they work in many different areas, for many different age groups. With the right preparation and delivery they can “serve as springboards” that “engage students and faculty in collaborative problem posing, problem solving, and persuasion.” In other words, discourse.

“Case method teaching brings together three components: an appropriate case, students who are prepared to engage with the case material in a discussion, and an instructor who knows the case, has a plan for the discussion and is ready to deal with the unexpected.” (more). There are two well known approaches (Desiraju and Gopinath, 2001), the traditional Harvard Case Model (HCM) and an alternative proposed in the early 70s in response to criticism of HCM, the  McAleer Interactive Case Analysis (MICA) method (quoting McAleer, 1976; McAleer & Hale, 1992; Siciliano & McAleer, 1997). Desiraju and Gopinath conclude, “…students in the MICA method section reported better preparation and participation benefits as compared with students in the HCM method. In addition, students in the MICA class were better able to identify the main focus of the cases discussed, showing that they were able to better recall the content issues involved in the case discussion. Thus, on both counts of content and process, the MICA method appears superior” (2001, p. 406), influencing my current proposal, which follows.

I’ve written earlier about literal and extended meanings of discourse, and at how it can be at once a tool or model that describes, defines, and delineates narrative, and the narrative itself (see Foucault, or Derrida, for example). As we’ve heard, “…students develop skills, abilities, knowledge, and approaches, as well practice and discipline in becoming more reflective and creative. Most of the major theories of learning developed over the years all point toward effective learning being rooted in experience through the use of collaborative inquiry, discovery, reflection, and critique” (Booth, Bowie, Jordan & Rippin, 2000).

Children and Issues of Fairness

Our lives are “a series of unrelenting power struggles” (Buckmire, 2014, p. 0). Shaw, DeScioli, and Olson (2012) expose an “…inherent tension between favoritism and fairness” leading to “two related questions about children’s developing social behavior. First, how do children make allocation decisions when favoritism and fairness conflict? Second, how do children judge other people’s decisions about tradeoffs between favoritism and fairness” (p. 737)? I propose that cases relating to favoritism and fairness be used within a case method framing to instigate classroom discussion.

“There are few discussions of case teaching in the context of increasing student diversity or numbers, or of the use of the method on undergraduate programmes generally,” say Booth, Bowie, Jordan & Rippin (2000, p. 64), and probably fewer still that study its use with children and adolescents. This presents opportunities for field work and projects that blend other exciting developments, such as Maker Education (“…a unique combination of artistry, circuitry, and old-fashioned craftsmanship…”), to situate learners in collaborative inquiry and project-based settings that may develop and challenge their critical thinking in truly transformative ways. 

Where to obtain content

If your interest is fairness and you’re looking for stories to spark conversations there are undoubtedly many sources, and I hope you’ll add your own suggestions in the comments. In the meantime, I invite you to take a look at the Ontario Human Rights Commission’s Teaching Human Rights in Ontario: A Guide for Ontario Schools, and the case studies available within. As it’s a public document, provided by the Government of Ontario, you’re free to do with it as you please, as long as you credit the source and you don’t remove the Queen’s Printer’s copyright.

These are actual cases, that set the precedent, that made the laws, that inform the Ontario Human Rights Code. The Commission says “The case studies in the Students’ handouts section can be approached in two ways.” Really? …only two? It’s clear Ontario’s students can imagine at least 3 general categories of 21st Century multi-modal literacy students themselves identify as meaningful: games, apps, and video.

All of these can take many forms, and if we educators lack the imagination or experience to think in so many forms, students certainly don’t. Take a look at what students put together with Mozilla Webmaker and the Canada Privacy Commission last year.

I’m volunteering to help

In the coming weeks I’ll provide tentative lesson plans for a few of my own ideas. I’ll work with any teacher anywhere (via the comments section) to customize the plan(s) for your own learning situation. They include…

  1. #HourOfCode (or 2 or 3) building a web app, with teacher and class versions so you can learn together
  2. More web app stuff using online resources from THRiO (Human Rights Temperature and Glossary)
  3. Digital Storytelling using green screen and 3d techniques (this video goes with OHRC Case Study #9, “Tawney” the BC Firefighter… do you have a student that might be called “too short?” Do you think the person is invalid, or the standard?).
  4. More digital storytelling and games using such digital literacy supporting as Twine, Vine and ;

I’m ramping up to share these ideas and techniques in detail. Please watch this space!

§

Reference, further reading

Boehrer, John and Marty Linsky, “Teaching with Cases: Learning to Question,” in M.D. Svinicki (ed.), The Changing Face of College Teaching, New Directions for Teaching and Learning, no. 42 (San Francisco, CA: Jossey-Bass, 1990), p. 42.

Booth, Charles; Bowie, Stuart; Jordan, Judith; Rippin, Ann (2000), The Use of the Case Method in Large and Diverse Undergraduate Business Programmes: Problems and Issues, The International Journal of Management Education

Buckmire, Mark J. (2014), Human Fairness: An Evolutionary Approach,

Crone, E. A. (2013), Considerations of Fairness in the Adolescent Brain. Child Development Perspectives, 7: 97–103.

Desiraju, Ramarao and Gopinath, C. (2001), Encouraging Participation in Case Discussions: A Comparison of the Mica and the Harvard Case Methods, Journal of Management Education 2001 25: 394, pp. 394-408.

Foucault, M. (1990) The History of Sexuality Vol. 1: An Introduction New York: Vintage.

Minks, Larry C. (1998), The Comprehensive Case Study Method: Insights Into The Course Journey,

McAleer, G. (1976). Listening as away to teach marketing policy. In H. Nash & D. Robin, (Eds. ), Proceedings: Southern marketing association 1976 conference (pp. 106-108). Atlanta, GA: Southern Marketing Association and Mississippi State University.

McAleer, G. M. , & Hale, J. R. (1992, October). Want to increase student participation in marketing case courses? Try the MICA method. Paper presented at the American Marketing Association Annual Meeting, Chicago, IL.

O’Grady, Emmanuel; O’ Reilly, John; Portelli, John P.; Beal, Candy (2014) Putting the Learner into the Curriculum, not the Curriculum into the Learner: A Case for Negotiated Integrated Curriculum, International Journal of Pedagogical Innovations, 2, No. 2 (July 2014) [Read online]

Shaw, Alex; DeScioli, Peter; and Olson, Kristina R. (2012), Fairness versus favoritism in children, Evolution and Human Behavior 33 (2012) 736–745.

Siciliano, J. , & McAleer, G. M. (1997). Increasing student participation in case discussions: Using the MICA method in strategic management courses. Journal of Management Education, 21(2), 209-220.

Recommended

How the Maker Movement Is Moving Into Classrooms – Vicki Davis, July 18, 2014 [Blog post]

Government of Ontario, Ministry of Education (2007-2015), Capacity Building Series

Government of Ontario, Ontario Human Rights Commission (2013), Teaching Human Rights in Ontario: A Guide for Ontario Schools also available as PDF

Student Voice in Ontario Schools SpeakUp Video

  1. Full disclosure: I work there. Neither this idea, nor any activity that may result from it, has anything to do with my position or duties, and this is not sanctioned or promoted by the organization, and I do not stand to benefit financially as a result of outside interest. I will benefit in self satisfaction, and perhaps in other ways no one can predict.
Apr 22

What would a 21st Century “Lesson Plan” look like?

A cartoon-like self portrait Richard did in Corel Draw 3 while in teacher educationIn teachers’ college, I was the Lesson Plans guy. I had blue-rimmed glasses, hair down to my shoulders, I wore sweater vests, and one of the first things I ever did on the Internet was to share lesson plans. One of the first collaborative projects I was ever part of—using what began as a Scarborough (Ontario) Board of Education software initiative and remains with us today as OpenText’s FirstClass—to create lessons to be tried, honed and re-shared by other teacher candidates. I quite enjoyed that activity, and I think it’s time to do it again, with the rest of the Internet.

There was collaboration on line long before words like “blog,” “wiki,” “social network were coined…”

But Intranets were closed, connections were slow, hardware was expensive and there weren’t a lot of people who owned technology—even fewer who used it well in classrooms.

We had a template, we discussed it together, tried them in our host classrooms adapted and applied it iteratively, worked lessons into integrated units, collaboratively, in practice. Master teachers contributed advice—or innovative projects to extend lessons into —but it was all entirely student-instigated, student-designed, and/or student “moderated.”

Our activities were facilitated by technology, but they were pedagogical activities.

We knew the Web had power, we wanted to be literate—we wanted to read and write the web.

A button I made from a GIF created in Corel Draw 3.0Technology was there to support an idea or activity, and when an expert was needed to make the technology work it was “facilitating a situation” and “enhancing the learning environment”, not “directing technology.” In every situation it was student-centered. But we were also teachers: of the students in our host classrooms, often of our host teachers—always of ourselves, always of each other. We call reading and writing, “literacies,” and we generally expect to acquire them in great part by a process sometimes called “schooling,” but we see that it doesn’t always work, and in fact can often be gained by “learning” in other ways, generally not called “schooling.”

Fast Forward to the 21st Century

The Internet is open, connections are fast, hardware is less expensive and there are many more people who own technology—and still, we hear, too few who use it well in classrooms. This kind of learning is messy.

Video is ubiquitous… but not very interactive… they said

Teaching the Web in the 20-teens looks different in some ways, others not so much. Popcorn.js is an exciting set of modular scripts that add interactivity and creativity to web video.

Games and Gaming

Storytelling is a primeval human activity that is quite fundamental to pedagogy. All games tell stories. Learners persevere with games; learning happens. Gamification is an immensely important trend “as a means of motivation and learner engagement” and Conole quotes Gee, 2008: “The potential of gamification, however, goes beyond promoting healthy lifestyles and marketing strategies. Gamers voluntarily invest countless hours in developing their problem-solving skills within the context of games” and says 21st century learning will reflect Gee’s ‘situated and embodied learning,’ “…meaning a student is not just being taught inert knowledge, rather using facts and information as tools for problem solving in a specific context and solving the problem (Gee 2011).”

“There’s an app for that”

Educational apps and the platforms they run on have changed. Mobile is ubiquitous and it’s not as hard as you may think to make a web-based app, even take it to the next level, make it native. The Open Educational Resource (OER) movement is founded on “The belief that everyone should have the freedom to use, customize, improve and redistribute educational resources without constraint, […] However, open education is not limited to just open educational resources. It also draws upon open technologies that facilitate collaborative, flexible learning and the open sharing of teaching practices that empower educators to benefit from the best ideas of their colleagues.” Read the Cape Town Open Education Declaration.

Learning design looks beyond instructional design

Learning design is defined as an application of a pedagogical model for a specific learning objective, target group and a specifc context or knowledge domain. The learning design specifies the teaching and learning process, along with the conditions under which it occurs and the activites performed by the teachers and learners in order to achieve the required learning objectives. LD is based on the metaphor of learning as a play instatiated through a series of acts with associated roles and resources. The core concept of LD is that a person is assigned a role in the teaching-learning process and works towards certain outcomes by performing learning activities within a given environment
—G. Conole, K. Fill (2005, pg. 5)

Learning design is an holistic praxis (Conole, 2014), the planning and executing of serendipitous situations within authentic contexts, that are controlled to enable the sought outcomes (Silver, 2011). Increasingly, the learner seeks the outcome. A learning design that includes multiple participants is increasingly expected to cater to individual learners (blogosphere, incessantly).

The Learning Design Toolkit has explored and created collaborative tools for designing active, situated learning. The short clip, (originally part of my contribution to a group presentation on cyberethics and Ursula Franklin) is meant to imply that the hard work of building shared understanding is generally worth the inevitable extra effort. Communication is a 21st century competency—why would the hard work to reform schooling be any different?

21st-century lesson plan learning design

I believe Aaron Silver, in his 2011 blog post The Fundamental design of learning activities, plotted a straight course from instructional design practices that seem overly prescriptive in the age of social networking and on-demand learning objects, to a more appropriate framework and in doing so reminded us, “learning is not a noun.” In a 21st-century learning design the activity must be at the center of everything. It appears you should start with a clear idea of what is to be achieved, and then create the situation in which that can happen, choosing participants and experiences that support the intended outcomes, and strategically placing them in order.

Graphic. Activity at the center of boundaries (conditions), content, context, and participation. 

Source—Aaron Silvers (2011)

Even documenting such activity can be much different in the 21st Century. How do video, blogs, and photo sites affect the recipe? 21st century activities might look like Heidi Siwak’s blog—like this. But if the ‘this’ is a “messy” learning activity, do a on an ‘app’ metaphor, or the bubbles of mind maps offer some helpful closets to stash our ‘mess?’

Can organizational change happen quickly enough to allow teachers such as Heidi, and students such as hers to flourish, or will she have to wait 15 years as others have?

In my post, “CompendiumLD for Learning Design,” I showed a “mind mapper” that has collaboration tools built in. In “Can (messy) mind maps enable tidy linear strategies within messy situations?” I show the danger of getting too thickly into context (top right image) and what I believe Aaron Silvers’s simple graphic becomes when you start adding real activities and participants (see images 1-6, created with another mind mapper, designVUE).

Image. mind map

§

Inspiration

Michael Faustino Deineka

The Faculty of Education at York University

Reference

Collins, Allan; Brown, John Seely; and Holum, Ann (1989a), Cognitive Apprenticeship: Making Thinking Visible, American Educator [PDF].

Conole, G.; Fill, K. (2005), A learning design toolkit to create pedagogically effective learning activities, Journal of Interactive Media in Education 2005(08). [PDF]

Conole, Gráinne (2014) Reviewing the trajectories of e-learning, blogged chapter from forthcoming publication. Or start with my shorter overview [HTML]

Silvers, A. (2011) The fundamental design of learning activities. [HTML]

Siwak, H. (2014) Creative solutions are no accident [HTML]

Jan 18

CompendiumLD for Learning Design

When the Open University funded the Learning Design Initiative in 2007 they asked about 4 specific aspects of the topic: efficiency & effectiveness of time spent designing learning; ways to represent innovative practice; access and availability of quality support for designers; the true nature of a quality design as it appears or presents in practice. With the continued support of Jisc they’ve produced a range of tools. When the OULDI picked an open source code base on which to build a collaboration-friendly tool to visually represent “a learning design” they “…considered various drawing packages, as well as more specialised mind mapping tools (such as Inspiration and MindManager).

Please note
Your browser can not display SVG so you will not see the interactive vmap that should be shown here.

To see the interactive map, please use a browser which displays SVG, e.g. Chrome, Firefox, Opera, Safari or Internet Explorer 9 and above.
Thank you.

In the end we choose to use Compendium, a visual representation tool, originally developed for enabling group argumentation…” (OU Website).

Compendium was already the Open University’s home-grown product. They set about adapting it specifically to the requirements of learning design, and they named it CompendiumLD. Learning Design is and evolution of traditional and established “instructional design” that provides a more holistic approach (Conole, 2014). Their tool truly does offer a “…range of flexible approaches to the design process,” the interactive SVG to the right, if you’re able to see and use it, is only one example, a “Sequence Map View.” Scalable Vector Graphics (SVG) is an XML-based vector image format for graphics that supports interactivity and animation (Wikipedia). If you’re getting JavaScript alert popup message when you mouse over blame them, not me!

Learning Design emerged “as a counter measure to Instructional Design. Driven primarily by researchers in Europe and Australia, Learning Design aimed to provide practitioners with guidance and support to inform their design process which is pedagogically effective and makes appropriate use of technologies. It is seen as a more encompassing term than Instructional Design, which operates primarily at the level of multimedia; in contrast Learning Design provides a holistic approach to the design process.
—Gráinne Colone, OULDI Project Lead (September 2008 – August 2011)

On the CompendiumLD corner of the Open University’s site you can also see a “Learning Outcomes View,” and a “Task Times View,” showing how you can use CompendiumLD to deliver timed assessments. For more advanced examples, see this Peer assessment using a wiki., or an example Modelling adaptations featuring open educational resources, “a design which shows how existing open educational resources can be included in an activity structure that caters for learners with different levels of skills and knowledge” created with a perhaps somewhat dated (<frameset>, <script Language="JavaScript1.2">) but nevertheless reliable and robust1 Web Export functionality that lets you share your designs with collaborators and other learners.

If there’s anything “wrong” with Compendium and CompendiumLD, you see it in these screen shots… is it perhaps a somewhat 90s, or turn-of-the-21st-century look to the icons? Never mind! Don’t let that distract you from what you can do with CompendiumLD. If it still bothers you, you can in fact change the images, icons and stencil sets, and it’s source is freely available — if you’d like to work on the interface the community will likely be grateful. Just look at CompendiumNG if you’ve any doubts there’s a next generation coming up in the Compendium family.

As part of the JISC Curriculum Design project (OULDI_JISC), four other [higher education] institutions (Brunel, Cambridge, London South Bank and Reading Universities) have been trialing and exploring the use of the OU learning design methodology. The purpose of these pilots is to determine the transferability of the OU methodology across a range of different HE organisations. In addition the pilots will provide the project with valuable feedback about the tools and resources developed as part of the OULDI-JISC project, and the approaches we have used to introduce and embed the methodologies institutionally (workshops, special interest groups and the toolbox etc). These Universities previously worked together as a cluster group for the HEA Pathfinder Project, on which Gráinne Conole was critical friend and it is expected that this work will build on, and extend on, that project.

I’ve had a strong sense of the value of these tools—and of the entire paradigm surrounding their development2 and use that seems to me so well-aligned with the long-established findings of cognitive apprenticeship—since they first came to my attention only a couple years ago. I’m truly excited to see their work expand and continue.

§

Further reading

Conole, Gráinne (2014) Reviewing the trajectories of e-learning, blogged chapter from forthcoming publication. Or start with my shorter overview

The Open University Learning Design Initiative “Our aim is to develop and implement a methodology for learning design composed of tools, practice and other innovation that both builds upon, and contributes to, existing academic and practitioner research. We have been working across several OU faculties and with 4 other universities to pilot curriculum design activities and relevant supporting tools and to contribute to the broader academic work in the subject.”

Jisc, “UK’s expert on digital technologies for education and research”

Fouchaux, Richard C. (2013), Thick learning situations: paths towards a framework for 21st-century learning design, project, paper and various web applications [HTML]
[…demonstrating, if not quite explaining, its own subthesis—the impending obsolescence of the traditional paper—and the work left to be done in utilizing new forms, and raising them to the status of other literacies! My MRP, the birth of this site. -rcf]
.


  1. By comparison, I discovered Visual Understanding Environment (VUE), a similar tool from Tufts University, has advanced as far as image maps enhanced with an early version of jQuery, but I found it very easy to break by putting HTML or the wrong text characters into the Node Notes.
  2. Back in 2011 I tried to say it in 10 seconds, but it took me 11, and maybe it’s not entirely clear I’m talking about the same issues. What do you think? [video]

§

Jan 15

Overview of Gráinne Conole’s “trajectories of e-learning”

Reviewing the trajectories of e-learning – Gráinne Conole

Gráinne Conole is Professor of Learning Innovation and Director of the Institute of Learning Innovation at the University of Leicester. Her work into applications of technology in learning is trailblazing and prolific (e.g., Conole & Fill, 2005; Conole, and Alevizou, 2010; ISC report JISC 2011; Conole, 2011; Conole, 2013). In this chapter from a forthcoming book that she posted to her blog today she summarizes the state of the art very well, however you may find as blogs go, it’s still a long read. Here’s an overview. I hope it’s of interest and you’ll visit her site to read the entire thing.

Professor Conole stresses The growing importance of ICT in education and quotes from a UNESCO 2005 report that saw 7 applications of technology in learning:

  1. to improve administrative efficiency and provide a pan-institutional infrastructure for managing learning, teaching and research.
  2. to disseminate teaching and learning materials to teachers and students, usually through an LMS and resource repositories.
  3. to improve the ICT skills of teachers and students and their digital literacies and competences
  4. to allow teachers and students access to sources of information from around the world.
  5. as examples of good practice and mechanisms for sharing ideas on education and learning.
  6. provide spaces for academics and students to collaborate on joint projects. These can also be used to support collaboration for research projects.
  7. to conduct lessons from remote locations and support distance learning. This can include both synchronous and asynchronous communication.

She provides a timeline of technology’s application “…from being a peripheral innovation to being part of the core services we offer learners. Each item on the timeline is discussed in turn.

Graphic, Figure 1: The e-learning timeline, source: Conole, 2014, blog

Figure 1 shows the e-learning timeline the chapter is based on. Professor Conole discusses each of the key technological developments that have arisen over the past thirty years

Professor Conole talks about the evolution of Multimedia Authoring Tools (like Adobe Captivate and others), The Web, “Learning Objects” (which are not the equivalent of “eLearning modules,” but “precursors to the Open Educational Resource (OER) movement”), and Learning Management Systems:

Graphic, Figure 2: Components of an institutional LMS, source: Conole, 2014, blog

Figure 2: Components of an institutional LMS
LMSs provide a hub for learning materials and course delivery and often also cover the management of course registration, course scheduling, discussion forums, blog sites, student scores, and student transcripts. LMSs contain a number of tools for presenting learning materials, for communication and collaboration and for managing assignments.

Professor Conole says Mobile Devices are gaining traction because they can be “used across different learning spaces, beyond the formal classroom setting, into the home and within informal learning contexts, such as museums.” And they are.

This very important distinction is highlighted in Professor Conole’s overview:

Learning Design emerged “as a counter measure to Instructional Design. Driven primarily by researchers in Europe and Australia, Learning Design aimed to provide practitioners with guidance and support to inform their design process which is pedagogically effective and makes appropriate use of technologies. It is seen as a more encompassing term than Instructional Design, which operates primarily at the level of multimedia; in contrast Learning Design provides a holistic approach to the design process.

Gamification is an immensely important trend “as a means of motivation and learner engagement” and Conole quotes Gee, 2008: “The potential of gamification, however, goes beyond promoting healthy lifestyles and marketing strategies. Gamers voluntarily invest countless hours in developing their problem-solving skills within the context of games” and says 21st century learning will reflect Gee’s ‘situated and embodied learning,’ “…meaning a student is not just being taught inert knowledge, rather using facts and information as tools for problem solving in a specific context and solving the problem (Gee 2011).”

[The Open Educational Resources (OER) is] …promoted by organisations such as UNSESCO and the William and Flora Hewlett Foundation. UNESCO argues that Education is a fundamental human right and therefore educational resources should be freely available.” She concludes this section “The OER movement has been successful in promoting the idea that knowledge is a public good, expanding the aspirations of organisations and individuals to publish OER. However as yet the potential of OER to transform practice has not being realised, there is a need for innovative forms of support on the creation and evaluation of OER” noting strongly that Hewlett Foundation, Atkins et al. (2007) said “adopt programs and policies to promote Open Educational Resources” is one of the five higher-level recommendations in the conclusion to the report.

Learning occurs wherever Social and participatory media appears (quality and scope of learning varies greatly). Conole draws from her prior work (Conole and Alevizou, 2010) “a review of the use of social and participatory media in Higher Education. [the authors] adapted a taxonomy of types of Web 2.0 tools (O’Reilly 2005) developed by Crook et al. (2008) based on the functionality of different tools.” She then lists 10 tool types, 3 trends and 5 characteristics—Peer critiquing, User-generated content, Collective aggregation, Community formation, Digital personas —that we can expect to continue into the 21st century.

She discusses the initial excitement around Virtual worlds, something I was also once very excited about, about which I came to the same conclusion: “Part of the problem is in the fact that the current Virtual Worlds are still difficult to use and part of the problem is that there are not many learning interventions where other technologies can be just as appropriate, i.e. it is not clear that the investment in time in building and using the Virtual World is worth it.”

The remainder of the article is devoted to the growing role and importance of E-books and smart devices, Massive Open Online Courses (MOOCs), arguing effectively for an alternative classification system based on 12 dimensions, and the emergence of Learning Analytics—data collection and its uses.

Professor Gráinne Conole wraps up her review of the key technological developments of the last 30 years with advice on what to look out for in the months and years ahead, where to look, and the following ideas and assertions:

To conclude, the nature of learning, teaching and research is changing as a result of the increasing impact of technologies in education. We are seeing changing roles and evolving organisation structures. In addition, disruptive technologies, like MOOCs, are challenging traditional educational business models and new models are emerging. We need to think beyond the distinction of campus-based and online learning, to focus more on the notion of Technology-Enhanced learning spaces.[41] We cannot as individuals or institutions afford to ignore technologies, we need to harness the characteristics of new media and adopt more open practices in our learning, teaching and research.
– Gráinne Conole

I first learned of professor Conole’s work in graduate school while doing a major research project, when charting a path from cognitive apprenticeship to design research took me through the realm of Compendium.

If you’re interested in these things, I highly recommend the entire piece. Reviewing the trajectories of e-learning

§

Professor Gráinne Conole, Professor of Learning Innovation
Director, Institute of Learning Innovation, School of Education, University of Leicester

Oct 03

Where learning happens, there shall ye find teachers

It’s hard to imagine anyone arguing that the digital age, social networking, animation, other event timing software (from Adobe Captivate to Mozilla’s Popcorn & Butter) and 24/7 access won’t change—haven’t already changed—the way teaching, learning, and schooling are done in the 21st century. But I’m becoming increasingly vexed by those suggesting technology will replace teachers, that for-profit social networking platforms will replace professional development—or that either of those propositions is a good idea.Wordle including 21st Century Skills and other current terminology

What has been will be again,
what has been done will be done again;
there is nothing new under the sun.

Ecclesiastes 1:9

I’ll dispense with the obvious semantic argument right away: even in self-guided learning there is a teacher—we say “I taught myself!” If informal learning is truly “a spontaneous process of helping people to learn” and it really “…works through conversation, and the exploration and enlargement of experience…” if its “…purpose is to cultivate communities, associations and relationships that make for human flourishing…” then not only do I hope we all find and fill that role almost every day—I shake my head in bemusement at the eagerness with which many, perhaps even TVO’s perspicacious and typically uber-informed Steve Paikin, seem to be anticipating teaching’s impending doom.

Screenshot of Hypercard from a 1980s era Macintosh Performa

Screen shot of 1980s era Macintosh Performa and Hypercard, technology that “changed the way we learn” over 30 years ago. Source: Stanislav (2011)

Fortunately, I don’t believe the host, nor any of the panel members in this thought provoking series actually believe this rhetoric; in places like Canada where the commitment to public education is for the time being less precarious than many other places, this can still be said with tongue-in-cheek. Overall, throughout the musings of this panel the vital role played by teachers, mentors, coaches, and guides was implicit. The skills, creativity and imagination professional educators bring to the situations they design and create for the purpose of conveying the knowledge they need to share, was celebrated openly. Overall there was full recognition of the approach most strongly suggested by the literature and research—and who can be seen to have been doing the “thickest” (à la Clifford Geertz1) research for decades. [Update: yours truly on Geertz.] I was schooled in the public school system of Bethlehem, PA, USA in the 1960s. My teachers sat us in circles, let students lead reading groups while they circulated giving individualized instruction, we split into groups and did jigsaw investigations, returned and taught our classmates how to put the pieces together. Tropes and talking points, pompous assertions around “industrial” or even “agrarian” paradigms notwithstanding, throughout history educators, including teachers in the trenches, have always led the search for ways to improve and enhance the process of helping people to learn.

The Cognitive Apprenticeship framework of the 80s identified elements of the mentor/apprentice relationship (e.g., “scaffolding“) that have been essential to teaching and learning for centuries, and educators ever since have been mapping these to specific strategies and the software that supports them.

A tool such as Twitter can be a useful tool, even a powerful one in the right hands. But it’s absurd to think a platform limited to messages 140 characters, blocked by governments and firewalls, adopted thus far by a trivial percentage of teachers would be a good pick to “replace professional development,” as one person on the #Learning2030 hashtag asked Wednesday night. Leave alone the fact Twitter’s priority is making money for its shareholders, and that we don’t know what this corporation may do, or not, to protect privacy. About 80% of messaging on Twitter is self-promotion—researchers coined a new term for such Tweople, “Meformers,” in contrast to “informers” (Naaman,Boase,& Lai, 2010). While I agree teachers should try Twitter, I see Twitter being used as a hub, the water cooler in the staff room around which informal learning happens, contacts, connections and preliminary plans to make plans. Just like pencil and paper, Twitter’s the right technology for many jobs. Use it for what it does well.

Several panels have noted how kids “intuitively” adapt to new technology, but I heard none remark that human-computer interface designers have been striving to design “intuitive” interfaces since there have been computers to design interfaces for. A book written on the topic in 1987 was still in use in 2010.

It’s wonderful to be in Ontario having important and fruitful conversations with genuine reformers, so sincerely devoted to student engagement, deep learning and the new possibilities awaiting discovery by all of us. There’s no need to believe we are the first to have these conversations, nor will we be the last.

§

  1. For many decades, forward-thinking, innovative educators have been engrossed with the exploration of applications technology. See, among many examples, posts in my own Cognitive Apprenticeship category and the various works in their reference sections. For evidence of the extensive range technology-enhanced-learning-focused 20th century collaborations across disciplines, look no further than R. G. Segall (1989), Thick descriptions: a tool for designing ethnographic interactive videodiscs, ACM SIGCHI Bulletin, Volume 21 Issue 2, Oct. 1989 pp. 118 – 122. While doing so please remember, there’s nothing new under the sun.

Further reading

Ghefaili, Aziz (2003) Cognitive Apprenticeship, Technology, and the Contextualization of Learning Environments, Journal of Educational Computing, Design & Online learning Volume 4, Fall, 2003.

Harkinson, Josh, (September 24, 2013), Here’s How Twitter Can Track You on All of Your Devices, Mother Jones, retrieved 2013-10-03

Junco, Reynol; Elavsky, C. Michael and Heiberger, Greg (2012), Putting twitter to the test: Assessing outcomes for student collaboration, engagement and success, British Journal of Educational Technology (2012) 1-15. (Wiley Online Library)

Lave, Jean and Wenger, Etienne (1991). Situated Learning: Legitimate Peripheral Participation. Cambridge: Cambridge University Press.

Lave, Jean (1996). Teaching, as Learning, in Practice, Mind, Culture, and Activity (3:3) pp149-164.

Lowe, Tony & Lowe, Rachael (2012) Twitter in learning and teaching – literature review (webducate.net)

Stanislav (2011), Why Hypercard Had to Die, blog post, http://www.loper-os.org/?p=568

Naaman, M., Boase, J. & Lai, C. (2010) Is it really about me? Message Content in Social Awareness Streams. Proceedings of the ACM Conference on Computer Supported Cooperative Work, February 6-10, 2010 in Savannah GA (PDF).

Webducate [‘webducate.net’ website/blog] (2012), Twitter in learning and teaching – literature review http://webducate.net/2012/08/twitter-in-learning-and-teaching-literature-review/, retrieved 2012-12-03

Wenger, E. (2006) Communities of practice, a brief introduction, http://www.ewenger.com/theory/, HTML retrieved 2011-11-03 or http://wenger-trayner.com/wp-content/uploads/2012/01/06-Brief-introduction-to-communities-of-practice.pdf, PDF retrieved 2011-10-03.

Richard studied music as a teenager with Trevor Payne at John Abbott College and attended Berklee College of Music in Boston. He has performed across Canada with full-time rock bands since the early 80s. He’s been a teacher of rock, jazz & classical guitar, first as a sub for his own private teacher, formally at the now defunct Toronto Percussion Centre, and taught at The Arts Music Store in Newmarket, Ontario, for 6 years. He holds the degrees of Bachelor of Fine Arts Music (Special Honours), Bachelor of Education, and Master of Education from York University, plays guitar and trombone, and taught grade 6-8 band, math and computers (HTML and yes, Hypercard!) at the Toronto District School Board and North York School Board.

Apr 07

Learner Privacy

Heidi Siwak has what strikes me as a very important post on student privacy, that really extends to participants of any kind in all kinds of online learning situations. She’s shared the slides from a presentation she did for the Association for Media Literacy that raises some important issues, and makes some important arguments. I highly recommend her post and presentation, linked above with a direct link to Information and Privacy Commissioner/Ontario’s Operationalizing Privacy by Design: A Guide to Implementing Strong Privacy Practices.

A lot of research is still required here, but it will become easier when those in the know have compiled some practical lists of things we may want to do, and best practices for addressing learning participants’ privacy. I have this contribution to the list.

Quite recently I was responsible for posting a set of learning videos that are streaming from YouTube onto my own organization’s Web site as “embedded iframes.” I instinctively chose the high-privacy URL pattern from the choices. Heidi’s post vindicates my gut feeling, which falls under Office of the Information and Privacy Commissioner/Ontario’s Foundational Principle #2, Privacy as the Default Setting. This should be considered a “best practice” for educators.

The pattern is (irrelevant pieces faded)…
https://www.youtube-nocookie.com/embed/EOicdh2C8A0?rel=0
Two parts of that are for the end-user’s protection: https sends information in an encrypted format, and youtube-nocookie.com is a domain YouTube—to their credit—has set up for privacy by not using cookies to read and write to your hard drive, exposing information about your surfing habits.

A third part worth noting is the ?rel=0 at the end. That protects my organization and the end-user from random “Related Videos” after the video, that may or may not be appropriate. If your YouTube link for any reason already has a ?anything=anything you should leave that intact and add &rel=0 to the end, e.g., ?x=y&rel=0.

The other part of the URL is the video ID. If you follow that link it takes you to the first video in a series of 5, on YouTube. We “embedded” them on our own site because there’s much more to it than that, so if you’re interested in that content, the entire series (Working Together: The Ontario Human Rights Code and the Accessibility for Ontarians with Disabilities Act) is here.

Please feel free to comment, and leave any tips you may have for preserving Privacy By Default.


Further Reading

Association for Media Literacy
HTTP Secure (Wikipedia)
Office of the Information and Privacy Commissioner of Ontario


§

Dec 09

Educators see Twitter at the hub

Twitter infographic

Authenticity in learning can be understood as the extent to which the learning is situated within a practising community of people who share some united interest in the knowledge being sought or produced, and a common idea of its meaning and value, “…who share a concern or a passion for something they do and learn how to do it better as they interact regularly” (Wenger, 2006) Sociology is an integral element of the authentic learning environment.

  On Twitter’s 140-character limit…

Several authors have argued that rather than this being a drawback, this characteristic offers benefits for learning. Educause (2007) suggests this helps develop skills “in thinking clearly and communicating effectively”. Rankin (2009a & 2009b) notes that this forces students to focus on a central point. Dunlap & Lowenthal (2009) argue that communicating in this style is a “professionally useful skill for students to develop”.
…However this aspect of Twitter, …has also been blamed by academics for contributing to declining English writing skills (Kelley 2010).

There is now plentiful evidence that a growing number of educators, and many more who think of themselves as stakeholders in education generally, are using social networks, and more than a few sites and software applications have emerged to compete for parents’, students’, teachers’ and administrators’ attention, everywhere, all at once. There are powerful new ways to create, manage, and share your own resources and an overwhelming number of great resources available from others. While a site like Pinterest may drive a great deal of traffic to blogs the micro-blogging tool Twitter’s unique feature set has helped establish its role at the hub.

3 Ways Social networking impacts and supports learning

Social networking platforms and tools are already impacting and supporting learning in at least three ways. First, social networking itself is a tool with a skill set for learning. Second, social networking can be used to deliver and enhance curriculum. And third, social networking can be utilized to create learning experiences in collaboration with others. Teachers find individual articles such as 30 Twitter Hashtags For Science Lovers and 50 Ways to Use Twitter in the Classroom immensely helpful, but if my own timeline is an indication, they do add up! Most of probably hundreds of such no-doubt wonderful ideas often get swept away in the “digital noise.” A classroom teacher’s bookmarks can include Edmodo, YouTube, and Facebook, Teachhub, PBL-Online and Edudemic, but it’s increasingly clear that Twitter is the choice to join these spokes at the centre.

New Twitter users commonly describe an experience curve that travels from scepticism, trial participation, conversion (getting it), dramatically increasing usage and connections (Levine 2007, Stevens 2008, Seimens 2008, Shepherd 2009) through to potential overload (Sierra 2007).

Teachers use Twitter to plan field trips, chat with industry professionals, connect classrooms, facilitate research, post supplementary materials, to engage students in the classroom, parents outside the school, and colleagues and administrators in networks they can design according to need and interest.

It’s not surprising to learn that “design of teaching strategies and practices related to virtual engagement and collaboration is instrumental to achieving positive educational outcomes,” but some early research suggests not all are equally ready, that students may need “…to improve their capacity to initiate self-directed, collaborative practices as a means to more effectively take ownership of their learning” through incorporating new technology. (Junco, Elavsky, and Heiberger, 2012). Similarly for teachers, learning to use Twitter to grow an effective Personal Learning Network (PLN, a.k.a. Community or PLC) is not the same as learning to use it as a tool in a learning situation, in or out of the classroom.

What you Tweet, when you Tweet it, the length of your Tweets, whom you retweet and who retweets you are all factors in getting established on Twitter. You can over-use hashtags or under-use them, and good use of images in tweets can make your tweets up to twice as engaging.

TweetStats is a service that reveals a great deal of information about how people actually use Twitter. One tab shows how many Tweets happened, when, in reply to whom, from what kind of device, and top retweets for a particular user. On another you can visualize the data as a word cloud1 (called a TweetCloud, naturally) of top mentions and topics, and once you’ve done so for an account you can track follow and unfollow stats from that point forward. If you have an idea of a rubric2 demonstrating engagement and on-task behaviour, or other standards you wish to establish, either for your personal learning community or a learning experience you design, TweetStats can already report some enlightening information. It seems to me this is a direction in which educators can push for development, or show initiative by launching their own open source projects.

As a stakeholder in on line education, what other sets of data would you like to see in statistical reports? Must diagnostic, formative and summative assessments be built in? How would you do that? What would it look like?

§


Notes

  1. From visual design, a word cloud is a form of weighted list, a visual representation for text data. Usually the importance of each tag, word or phrase being highlighted is represented by variations in font size or color.
  2. A rubric is a measuring tool that experience designers can use to assess participant learning and engagement. Using a set of criteria and standards directly tied to the stated learning outcomes, educators can assess each student’s actual performance. When a rubric is agreed-upon and communicated prior to the student’s work being completed, it serves as a model or exemplar, and makes the grading process clear and transparent.

Reference

Brown, J.S., Collins, A., and Duguid, P. (1989). “Situated Cognition and the Culture of Learning.” Educational Researcher, 18(l), 32-42.

Davis, Gordon B., Editor (1986) Understanding The Effectiveness of Computer Graphics for Decision Support-A Cumulative Experimental Approach, Communications of the ACM, Vol 29 (1) 40-47.

Dugan, Lauren (2012) How Frequently Should You Tweet? [STATS] posted October 30, 2012 on AllTwitter The Unofficial Twitter Resource http://www.mediabistro.com/alltwitter/how-frequently-should-you-tweet-stats_b30568.

Ferriter, William M. (2010), Why Teachers Should Try Twitter (Meeting Students Where They Are), Educational Leadership, 67(5) February 2010, pp 73-74;
[Available on line http://www.ascd.org/publications/educational-leadership/feb10/vol67/num05/Why-Teachers-Should-Try-Twitter.aspx, retrieved 2012-11-30].

Junco, Reynol; Elavsky, C. Michael; and Heiberger, Greg (2012), “Putting twitter to the test: Assessing outcomes for student collaboration, engagement and success” British Journal of Educational Technology [Early View, Article first published online: 1 MAR 2012 available from author’s site: http://reyjunco.com/wordpress/pdf/JuncoElavskyHeibergerTwitterCollaboration.pdf, retrived 2012-11-30]

Lave, Jean and Wenger, Etienne (1991). Situated Learning: Legitimate Peripheral Participation. Cambridge: Cambridge University Press.

Lave, Jean (1996). Teaching, as Learning, in Practice, Mind, Culture, and Activity (3:3) pp149-164.

Webducate [‘webducate.net’ website/blog] (2012), Twitter in learning and teaching – literature review http://webducate.net/2012/08/twitter-in-learning-and-teaching-literature-review/, retrieved 2012-12-03

Wenger, E. (2006) Communities of practice, a brief introduction, http://www.ewenger.com/theory/, HTML retrieved 2011-11-03 or http://wenger-trayner.com/wp-content/uploads/2012/01/06-Brief-introduction-to-communities-of-practice.pdf, PDF retrieved 2011-10-03.

Dec 02

Some best practices for posting infographics?

As often happens when we go searching the web for something, I ended up with something else, and learned something different than I started out to learn. I was searching for statistics about social media. I soon discovered how pervasive infographics have become, even compared to six months ago. When done well they are clearly very good at presenting data quickly and coherently. But there are some other things I expect when I go searching for data, and they seem to be as easily overlooked as they could be to include, if only we take the extra couple minutes to consider. I believe I’ve also seen some hints that with infographics it may even be easier to misrepresent and distort data than with such well-known devices as bar graphs, and well understood yet often repeated practices such as moving the origin to influence scale.Infographic

UPDATE: Accessible Image Maps (below, under Presentation)

From Wikipedia:
Information graphics
or infographics are graphic visual representations of information, data or knowledge intended to present complex information quickly and clearly.[1][2] They can improve cognition by utilizing graphics to enhance the human visual system’s ability to see patterns and trends.[3][4] The process of creating infographics can be referred to as data visualization, information design, or information architecture.[2]

Infographics aren’t new. The article above links their origin to cave paintings. I remember posters in my doctor’s office in the 60s that fit the description. Neither myself nor most of the adults in the waiting room would have been likely to pick up a peer-reviewed journal or seek out the study that uncovered the data being presented. There would likely be some fine print in the corner that indicated who prepared it, and you could track it down if you were interested. In the information age and on the World Wide Web that would be both lazy and unacceptable. For end users with sight, graphic presentation of data on the Web may be even more effective in some cases.
Whether graphs are actually superior to tables—in business decision-making, for example—has been a bone of contention for some time (e.g., Davis, 1986:46-7). I would suggest that on the World Wide Web the ability to select, copy and paste the text in a tabular display would in many cases be more satisfactory to many end users than an attractive display that was perhaps not as portable.

File Format

One “solution,” or perhaps just a happy accident, is that many infographics are posted as PDF files1. These can support embedded links, can be downloaded and printed maintaining the integrity of the original (and its copyright notices, etc.) and in many cases support copy/paste. PDF files can be made accessible; that becomes a process that must be included in the development cycle. As I’m writing this, it should be noted, only certain WebKit browsers—Chrome, Konqueror (Linux) and Safari  (Mac only)—display PDF files without additional software. Native and open formats like PNG are more universal. In my opinion SVG is the one to watch. It’s a “vector” graphic format, which means it maintains quality at any size. Most newer browsers will display SVG, and the spec contains some very exciting abilities of the “coming soon” variety, such as zooming, timecode and animation, that should greatly enhance our ability to organize and communicate the meaning of data. In either case you should put references, links, and anything else your visitor may want to know that isn’t in the data itself in plain text in a caption underneath. If you’re on WordPress there’s a caption box in its standard image upload form you can use. Regardless of platform this should be relatively easy and may go a long way to advance the usability and usefulness of your data.

Data Obfuscation

Infographics may contain mixtures of several types of data display, including graphs and tables. All of the abilities to distort and misrepresent data, whether intentionally or not, are therefor multiplied. A prime example is this infographic released by the US Republican Party to convince their constituency why they believed the Affordable Care Act was a bad idea. A combination of  illogical colour use, bad layout, poor choice of fonts and font-size, meaningless relative proportions and little white space make the system it claims to represent look overly complex, and to many perhaps, even ugly.

Republicans Party version of a graphic purported to represent ACA flowchartOn the site where this lives commenter Nick Dobbing, founder and principal designer at Wovenland Systems in Vancouver points out, “Notice all the bright primary colours in the chart, all the many different shapes, with no sense or order in the way they’re used. No help to anyone sincerely trying to comprehend the diagram… but boy howdy, it sure makes it look more complicated! And that’s all that this diagram is about.” When other designers redid the graphic with a commitment to display the information with integrity  it looks quite different.
Citizen designer Robert Palmer's graphic representing ACA flowchart

I encourage you to read Robert Palmer’s

Open letter to Speaker John Boehner from citizen designer Robert Palmer of California infosthetics.com

I’ve included only the portions relevant to my discussion.

  • I have removed the label referring to “federal website guidelines” as those are not a specific requirement of the Health and Human Services department. They are part of the U.S. Code. I should know: I have to follow them.
  • I have relabeled the “Veterans Administration” to the “Department of Veterans’ Affairs.” The name change took effect in 1989.
  • In the one change I made specifically for clarity, I omitted the line connecting the IRS and Health and Human Services department labeled “Individual Tax Return Information.”

Robert Palmer
Resident,
California 53rd District

Presentation

Many sets of data may form lovely graphics that are nonetheless too large and complex to fit a single browser window. In my experience a popular solution is to make the graphic longer, not wider. This is in keeping with a standard web mantra that vertical scrolling is okay, horizontal scrolling is bad. I’ve read recent reports that scrolling is less a big deal to those who’ve grown up on the mobile web, and it’s easy to find designers who agree. I’m a centrist in this case, I much prefer to get what I came for front and centre, but I’ll adapt and go with the flow—if it’s clearly a flow, not an eddy.

Accessible image maps are also worth considering. At minimum you must use ALT tag in the main image, and later in each hot spot. (Penn State, 2012)

The future

Designers are still discovering new abilities within HTML5. A feature with many yet-to-be-tapped applications is the new data attribute that can be applied to any element. Source code for a legacy tag that displays an infographic image might look like (press letter M to widen)
<img src="path/to/infographic.png" alt="Description of image">;
we call img the element, src and alt are its attributes. We can now add custom attributes that begin with data- and retrieve them easily with JavaScript (and even more easily with jQuery). For example,
<img id="myInfographicWithDataAttributes"
  data-mySource="Fouchaux (unpublished manuscript), Answer to the Ultimate Question of Life, The Universe, and Everything"
  data-mySourceURL="http://not-in-our-lifetime.com" src="path/to/infographic.png" alt="Description of image">

You can create a new object and retrieve the value
myData = $('#myInfographicWithDataAttributes').data();
What you called data-mySource and data-mySourceURL are now available as myData.mySource; and myData.mySourceURL


Conclusion

I think I’m getting some ideas about possible best practices for posting infographics. Please use the comment section to critique my suggestions and to offer your own.

  1. The most useful format when the graphic contains links, references end users may want to paste into a Google search, or the document is to be printed or downloaded is PDF1. However, currently only WebKit-based browsers: Chrome, Konqueror (Linux) and Safari for Macintosh can display PDF without additional plugins, PDF files can be large, and they require extra care to assure accessibility.
  2. Unless I absolutely need my audience to download and print I’d be inclined to post a PNG (all browsers) or SVG (all newest browsers) image and include links, references and citations in a plain text caption underneath.
  3. Mayer’s principles of multimedia design, especially concerning coherence and spatial contiguity, apply. Good use of whitespace, a sensible colour scheme are key, but these are indicators of good design in any medium. Illogical colour use, bad layout, poor choice of fonts and font-size, can obscure, distort, and render meaningless any set of data.
  4. I’m personally not a fan of long, skinny and scrolling. Unless the data demands otherwise I’d try to keep all the information visible at once. If scrolling is necessary there’s still general agreement that it should be vertical.

Further reading

The United Nations Statistics Division Knowledgebase on Economic Statistics offers these Making Data Meaningful guides that are “…intended as a practical tool to help managers, statisticians and media relations officers in statistical organizations use text, tables, charts, maps and other devices to bring statistics to life for non-statisticians. […] The first guide provides guidelines and examples on the use of effective writing techniques to make data meaningful. The second guide provides guidelines and examples on preparing effective tables, charts and maps, and using other forms of visualizations to make data meaningful. It also offers advice on how to avoid bad or misleading visual presentations. The third guide aims to help producers of statistics find the best way to get their message across and to communicate effectively with the media. It contains suggestions, guidelines and examples.”

PENN State’s Image Maps in HTML explains image maps and how to make them accessible.

§


Notes

  1. Note that PDF (in strictly speaking) is not an image format, but a scriptable rich text document format that can contain different types of multimedia content, including vector and bitmap graphics, audio, video, forms, intra- and inter-document hypertext links and a hierarchical contents listing. You should handle accessibility outside the web browser before attaching your PDF.

Reference

Davis, Gordon B., Editor (1986) Understanding The Effectiveness of Computer Graphics for Decision Support-A Cumulative Experimental Approach, Communications of the ACM, Vol 29 (1) 40-47. [PDF]
Dugan, Lauren (2012) How Frequently Should You Tweet? [STATS] posted October 30, 2012 on AllTwitter The Unofficial Twitter Resource http://www.mediabistro.com/alltwitter/how-frequently-should-you-tweet-stats_b30568

Penn State (2012) Image Maps in HTML, http://accessibility.psu.edu/imagemaps, accessed 2012-12-02

Educase Learning Initiative (2012) http://net.educause.edu/ir/library/pdf/ELI7052.pdf