 My research into educational, mostly open source software tools identified ones that have proven multi-tasking abilities within “authentic” learning situations (Conole and Fill, 2005; Conole, 2008). Among these, the so-called “Mind Mapping” tools stand out for what I think are several very good reasons. The image to the right, a “mind map” of a recent research project, shows the good, the bad and the ugly.
the rules common to all information systems do not cover the messy, ambiguous, and context-sensitive processes of meaning making, a form of activity in which the construction of highly “fuzzy” and metaphoric category systems is just as notable as the use of specifiable categories for sorting inputs in a way to yield comprehensible outputs.
—Jerome Bruner (1996 in Illeris, 2009, pg. 162)
It seems under-researched maybe, but I believe I saw indications, and I certainly have anecdotal evidence, that mind maps may lack meaning to people who for whatever reason(s) must solve problems in predominantly linear ways. In at least one case I’ve seen a mind map—the one of my research project at the top of the post—elicit genuine anxiety in a person with clinical anxiety disorder!
Messiness: the face of authentic learning
It’s certainly true that mind maps can get confusing. Connections become interwoven in admittedly “messy” ways—which, I argue, makes them particularly suitable to solving exactly the types of messy problems we increasingly face—although they often appear in ways that can understandably throw self-identified “linear thinkers” quite literally for a loop. It’s small wonder many people believe mind maps don’t, won’t, will never work for them. However, the same solutions cartographers have applied for centuries work in these maps too (Buckingham Shum and Okada, 2007), and are available in free tools with powerful multitasking abilities. Messiness is a fact of authentic learning situations (Collins, Joseph & Bielaczyc, 2004, pg. 19). Clinical settings and attempts to eliminate messiness can even be counter-productive (pg. 20). Describing the linear step pattern shown below in Fig. 1 (red line) Patricia Seybold says, “…we keep trying to shoehorn” Wicked Problems into that linear approach” (2013, pg. 3). I think what I’ll call linear imposition, the imposing of a linear framework or template on a non-linear situation, is at the root of Jean Lave’s “paradox” she says often causes institutionalized learning to fail (Lave, 1993, pg. 78). I believe ethnographers such as Lave have had an important impact on design thinking in education research and instructional design because of their “attempts to characterize relationships and events that occur in different educational settings. …ethnographic research produces rich descriptions that make it possible to understand what is happening and why” (Collins, Joseph & Bielaczyc, 2004, pg. 21). By “rich” descriptions Collins, Joseph & Bielaczyc mean “‘Thick,’ as in Geertz,” and by mapping these connections we contribute to the design of ‘thicker’ learning situations we hope result in deeper learning.
designVUE: lining up the non-linear
The problem is, while we may place things on lists and in lines to organize and sequence an approach, those things may have their own interconnections and internal organizations, especially if the “things” are groups of people with competing rights and interests. And so the line we draw prior to achieving full understanding of a problem is actually an imposition that changes the nature of the existing problem and causes new problems to arise. As Conklin has shown, solving problems is an iterative process.
How Humans Solve Opportunity-Driven Problems

Figure 1: From a 1980’s study at the Microelectronics and Computer Technology Corporation (MCC) that looked into how people solve problems. Each peak in the green line can be understood as heading “back to the drawing board,” yet each return to the drawing board carries all the experience of the previous attempts.
Source: Conklin, 2006 ©2006 John Wiley & Sons, 2013 CogNexus Group. For an excellent discussion, see also Seybold, 2013.
Mitigating Mind-Map Anxiety
Mind-map anxiety might be mitigated by applying well understood principles of cartography. Buckingham Shum and Okada (2007) say the analogy to cartographic representations of physical space is valid, providing “…an ‘aerial view’ of a topic by highlighting key elements and connections,” and calling mind maps “vehicles for summarising and negotiating meaning” (pg. 27). designVUE is one college design department’s enhancement of another university’s contribution to the open source software world and visual understanding. I think designVUE’s quick formatting tools and presentation mode lets us do some of the things map makers do. Some of these things are, or should be, in grade-level curriculum requirements—perhaps giving students hands on access to free tools like designVUE might support the teaching and learning of many.
Map coloring is the act of assigning different colors to different features on a map. There are two very different uses of this term. The first is in cartography, choosing the colors to be used when producing a map. The second is in mathematics, where the problem is to determine the minimum number of colors needed to color a map so that no two adjacent features have the same color.
—Wikipedia article
There’s nothing more linear than a time-line; as the first image shows, a mind-mapping tool makes it easy to display linear progression, so if this is the only objection, it soon crumbles. In designVUE you choose the colour scheme (“fill,” “line,” font “style”) and shape.
With the Quick Prototyping tool draw a line of bubbles in a quick succession of clicks…
 and shape and with the Quick Prototyping tool draw a line of bubbles in a quick succession of clicks…")
Image 1. In VUE you can use the Prototyping tool to draw a line of bubbles with a directional arrow between, or with standard tool place the thought bubble on a line or arrow.
Any individual “bubble” in the map may consist of much messier activities. Brainstorming, for example, is a spiral of ideas, questions, answers, and arguments. In designVUE you can use colour to visually set an activity apart, but you can also create pathways that hide and reveal specific sets of bubbles—overcome cognitive overload. Or group bubbles within each other as I’ve done here with a question, answer and pro/con set that illustrate IBIS, a system that often goes hand-in-hand another highly successful application of mind-maps: “dialogue mapping.”

Image 2. Part of a brainstorming session suggesting a circular and iterative process, shown in a different colour. With “Pathways” you can hide entire sections and choose different sequences.
But wait! Yes, there’s more! In these days of collaboration linear thinkers and their strategies are as important as ever. designVUE has a presentation tool that allows teams to construct linear pathways through maps of even the most complex dialogues, in order to gain clarity, reach consensus, and explain decisions to others. designVUE also does metadata in OpenCalais, allows you to store resources and documents in the bubbles, share maps as interactive HTML documents, reuse the same maps in multiple other maps… I’m only scratching the surface.
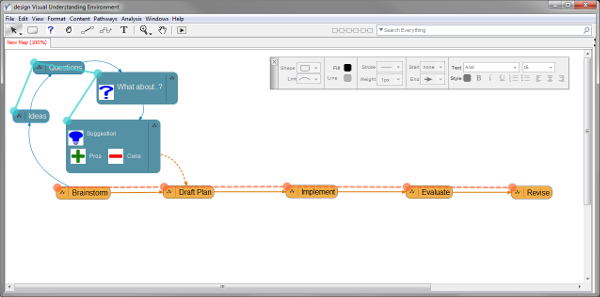
Image 3. Showing Pathways in the workspace. Also shown are the
IBIS icons for question, idea, pro and con arguments.
The Pathways panel allows you to create standard (linear) PowerPoint-like slides and bullet points, though not as effortlessly as the commercial product. VUE’s true power as a presentation tool takes some time to appreciate and master, but if your goal is to enhance a learning situation by creating memorable and meaningful visual connections between the content, and then using the same tool to convey those ideas to an audience this tool might be what you’re after.

Image 4. The Pathways panel allows you to show and edit more traditional PowerPoint-like slides. In effect VUE’s “Pathways” can be separate but related presentations, or audience-specific variations on a theme.
Panel closeup. The images can be sized, additional ones and text added to each slide that need not be shown in other views:

Image 5. Closeup of the expanded Pathways Panel. The order and whether it’s shown is determined here.
In Presentation mode, hitting Enter can shift to yet another view of the groups of ideas in the presentation. There’s definitely a learning curve but my early impression is this can potentially change the way you do presentations. I highly recommend this VUE tutorial for ideas and examples.

Image 6. In Presentation mode, hitting Enter can shift to yet another view of the groups of ideas in the presentation. See
this VUE tutorial for examples (note the PDF for download beneath the video player).
Summary
The types of 21st century problems we increasingly understand need taming—as they defy solving by their very nature—are “wicked problems.” This necessarily includes nearly all matters of public education, indeed of public policy as a whole, where the conflicting and intersecting rights and responsibilities of multiple stakeholders is always …messy! Governments are coming to recognize this. See the Australian Public Service Commission site for one well explained example (Commonwealth of Australia, 2007). In Canada Quebec and New Brunswick have already discovered the importance of understanding certain problems’ ‘wickedness’ in these ways. “As distinguished from problems in the natural sciences, which are definable and separable and may have solutions that are findable, the problems of governmental planning—and especially those of social or policy planning—are ill-defined; and they rely upon elusive political judgement for resolution. (Not “solution.” Social problems are never solved. At best they are only re-solved—over and over again.)” (Rittel and Webber, 1973, pg. 160).
Mind mapping, undertaken thoughtfully and with purpose (see Jeff Conklin’s video: The Limits of Conversational Structure), has proven its value in all aspects of teaching and learning. As a teacher I used it much as John Budd did here, and as an instructional designer I use it as a graphic organizer. When mapping strategies are used to both record, and then map dialog to describe real situation, and when that’s done openly and collaboratively as in situations such as Conklin has described and reproduced in practice for years it can lead to shared understanding and conflict resolution.
I don’t think it’s fair, or rational, to presume that everyone is going to instantly drop PowerPoint and buy into a mindmap-based workflow, and that’s not what I’m suggesting. While dialogue mapping can handle wicked problems, it can also do meeting minutes, so consensus can be achieved and documented by the most mutually comfortable and practical means—and the cartographers have a single one stop tool to gather and document the entire process, or to communicate it to others.
Conlusion
If we embrace all the 21st century models, or “competencies” seen emerging, the primary and inescapable one at the base of many others is asynchronous collaboration via digital networks. Can it not simply be that the divergent thinkers map their thoughts in collaboration with linear thinkers who further delineate the why and how of their musings? Taking up perhaps the next most agreed upon 21st century learning objective, critical thinking, it seems likely we can seek solutions to simple problems and taming strategies for wicked ones, discerning the difference. Mind mapping tools are web enabled and metadata ready. A strategy for taming wicked problems that uses mind maps, argument mapping or Conklin’s trademarked Dialogue Mapping, keeps track of pros, cons, and rationale, and documents decisions making around simple problems, but offers a powerful tool for the building of the shared understanding that must precede consensus around the taming of wicked ones. Formal training can be found, but the VUE, designVUE and various Compendium software sites themselves, Conklin’s and YouTube are probably the place to start—to get an, ahem… visual understanding of what mind maps and mind mappers might bring to which ever debate you’re having.
Maybe “Can messy mind maps enable tidy linear strategies within messy situations?” isn’t the right question. In my experience it still requires steps and sequencing to deal with the issues, but the graphic organization—the visual understanding—provided by maps in programs like VUE and Compendium, in the right hands, can really help you get a grip on the situation. It very well may need both types of thinking, and that well may require collaboration. Maybe the question to be asking is, “Are there any concept and conversation cartographers in your workplace or your PLN?”
§
Read more about mind maps
§
the assumptions proposed here amount to a preliminary account of what is meant by situated learning. Knowledgeability is routinely in a state of change rather than stasis, in the medium of socially, culturally, and historically ongoing systems of activity, involving people who are related in multiple and heterogeneous ways, whose social locations, interests, reasons, and subjective possibilities are different, and who improvise struggles in situated ways with each other over the value of particular definitions of the situation, in both immediate and comprehensive terms, and for whom the production of failure is as much a part of routine collective activity as the production of average, ordinary knowledgeability.
—Jean Lave
More VUE
The Visual Understanding Environment (VUE) is an Open Source project based at Tufts University
VUE is very well documented. The English user guide is here.
designVUE is a branch of VUE. It is an open source project based in the Design Engineering Group of the Mechanical Engineering Department at Imperial College London.
CompendiumLD is either fierce competition… or you can do as I do and use both! See the Learning Design-specific “stencils” in the screen shots. They’re easily ported to other Compendium flavours, and you could apply the concept in VUE with your own icons and very little extra trouble.
Reference
Bruner, Jerome (1996) Culture, mind, and education in Contemporary Theories of Learning – Learning theorists … in their own words, Knud Illeris ed., 2009, NY: Routledge; Edition published in the Taylor & Francis e-Library, 2009.
Buckingham Shum, Simon and Okada, Alexandra (2007). Knowledge Mapping for Open Sensemaking Communities. In: Researching open content in education – OpenLearn 2007, 31 Oct 2007, Milton Keynes, UK.
Collins, Allan & Joseph, Diana & Bielaczyc, Katerine (2004), Design Research- Theoretical and Methodological Issues, The Journal of the Learning Sciences, Vol. 13, No. 1, Design-Based Research:Clarifying the Terms. Introduction to the Learning Sciences Methodology Strand (2004), pp.15-42
Commonwealth of Australia (2007) Tackling Wicked Problems: A Public Policy Perspective, [Archived]
Conklin, Jeffrey (2006) Dialogue Mapping: Building Shared Understanding of Wicked Problems, West Sussex: John Wiley & Sons., Ltd., 242 pp.
Conklin, Jeff (2006b) Dialogue Mapping Demonstration, [unspecified journal, citation incomplete] CogNexus Institute, pp. 249-251 [Demonstration PDF].
Conole, G. and Fill, K. (2005). A learning design toolkit to create pedagogically effective learning activities Journal of Interactive Media in Education 2005(08). [PDF: jime.open.ac.uk/2005/08]. Gráinne Conole and Karen Fill, University of Southampton. Page 1 Published 26 September 2005 ISSN: 1365-893X [uses CompendiumLD]
Conole, G. (2008). Capturing Practice: The Role of Mediating Artefacts in Learning Design. Handbook of Research on Learning Design and Learning Objects. (Eds.) Lockyer, L., Bennett, S., Agostinho, S. and Harper, B. ISR Press. [Pre-print of learning design chapter on using compendium].
Lave, J., & Wenger, E. (1991). Situated learning. Legitimate peripheral participation. Cambridge, England: Cambridge University Press.
Lave, Jean (1993) The practice of learning in Contemporary Theories of Learning – Learning theorists … in their own words, Knud Illeris ed., 2009, NY: Routledge; Edition published in the Taylor & Francis e-Library, 2009.
National Collaborating Centre for Healthy Public Policy (2012) Tackling Wicked Problems in the Built Environment: Of Health Inequalities and Bedbugs [Workshop details]
Rittel, Horst and Melvin Webber (1973) “Dilemmas in a General Theory of Planning,” Policy Sciences 4, Elsevier Scientific Publishing, Amsterdam, pp. 155-169.
^ Seybold, Patricia B. (2013) How To Address “Wicked Problems” – Use Dialogue Mapping to Build a Shared Understanding and Evolve a Group’s Thinking, book review, [HTML | PDF]


 The past 30 years in education research has seen the influx of big ideas from computer science, social anthropology, design and even architecture. We now say learning is situated in authentic social contexts many call communities of practice.