Jan 19

Mind mapping for learning design

UPDATED: when you’ve read this, see my latest update on Gráinne Conole’s latest contributions to these ideas, linked at the end.

Mind map of CompendiumLD showing Getting StartedThe past 30 years in education research has seen the influx of big ideas from computer science, social anthropology, design and even architecture. We now say learning is situated in authentic social contexts many call communities of practice.

This has had some pretty significant effects on research itself (e.g., ethnographic case studies, action research), and learning design tools, themselves designed to reflect this current situation, but for reasons I won’t waste any more time pondering, the uptake still seems relatively slow. Gráinne Conole, with others at the Institute of Educational Technology, Open University UK, looked into an idea/concept/mind mapping tool, Compendium, that was already under development there, and in yet another demonstration of the efficacy of open source, created CompendiumLD, Compendium “Learning Design,” allowing designers to visualize the many connections that exist within learning situations. I believe such tools will play an increasingly important role in the design, planning and implementation of learning experiences.

Continue reading

Dec 13

Mind mapping, concept mapping—making the relationships between ideas visible

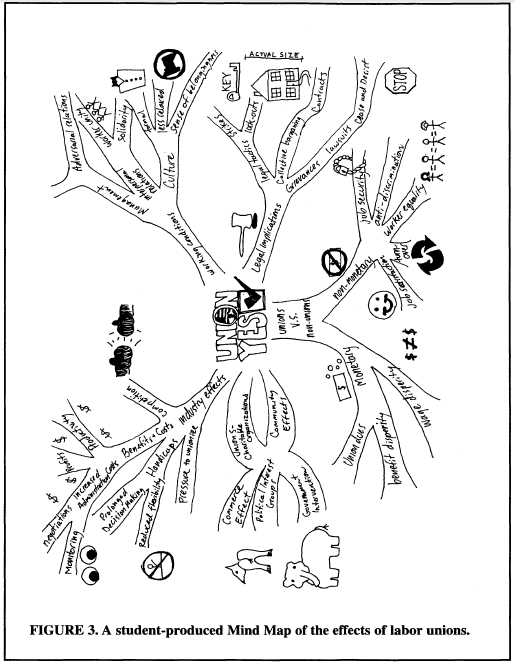
In his 2004 article published in The Journal of Economic Education John Budd describes an in-class exercise “…in which small groups of students each create a Mind Map for a specific topic.” He says creating mind maps is “…an example of an active and collaborative learning tool that instructors can use to move beyond “chalk and talk” …and incorporate diverse learning styles.” The author presents ideas for mind map topics for a wide variety of economics courses, and several lovely examples of students’ maps, drawn freehand and collaboratively. “hierarchies and associations flow out from a central image in a free-flowing, yet organized and coherent, manner.”Mind Maps can be lesson planners, lesson plans, and lessonsFirst page of article, Budd (2004)  about Mind Maps

There is now a good selection of mind- or concept-mapping software educational experience designers may find very helpful in making thinking visible, by offering ways to illustrate the connections between ideas. Nearly all of them are built for Internet collaboration. My goal in this post is just to share an inkling I’ve been getting that such software can find a role in lesson planning, lesson plans, and as John Budd and others have found, in the lessons themselves.

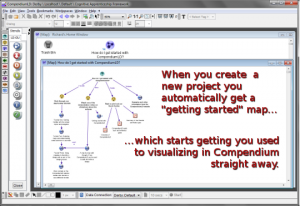
I wrote about one such program, Compendium, back in March, and I’ve tried my hand at mapping an understanding of cognitive apprenticeship. First I simply listed the pieces of the Collins, Brown and Holum (1991) framework, assigning symbolic icons to imply their role, positioning them visually so as to reflect their hierarchy. Then I use colour-coded arrows to indicate relationships between them. In the software these objects can all be opened as dialog boxes, which can store further details. “Mouseover” or “rollover” effects (anything the software does in response to a user placing their mouse pointer over something on the screen) let you peek inside.

UPDATE: I learned 2012-12-15 in Compendium Institute Newsgroup Digest #1389, that Compendium will receive a long overdue overhaul, and the source code seems to be finding its way to more friendly repositories. This recording of a Compendium developer meeting contains details, and may also be of interest to see how Compendium is used to add idea-mapping to the task of recording minutes. The recorded meeting demonstrates another technology-based approach to making thinking visible (and audible).

attempted Mind Map of cognitive apprenticeship

Fig. 1—Mapping the Cognitive Apprenticeship Framework
Trying to cover all the bases: making thinking visible while designing a lesson. Icons, positioning, colours, arrowhead direction have meaning, follow the designer’s logic… (cont…)

Two close-ups of the maps within (neither completed):

Map of Sociology of a learning experience

Fig. 2— Sociology
…general priorities and strategies unfold: coloured arrows illustrate relationships to and betweenthe ideas; each item can become a map of future brainstorming. Big questions asked here, “Have I planned for this?” “Who are my experts?” get deep answers at the next level…  (cont…)

compendium mind map

Fig. 3—Content
…where you can be clear and specific about content, methods, and activities. Compendium and similar software let you add lists, links, video, documents, and to publish the results.

These maps list the parts of the framework. In Compendium you can draw additional items as you brainstorm and you can put terms “inside” other items, for example double-click the Content->Questions icon and find the actual questions stored inside. You can label the lines, change the directions of the arrowheads or put arrowheads on both ends. You can also export an interactive version in HTML [also here and here] and other formats.

Wikipedia has a list of free and proprietary mind-map and idea mapping software. I’d like to try it all at some point but thus far I looked at “VUE,” or Visual Understanding Environment, a project at Tufts University. I found it to be very intuitive, it has a large and versatile set of features, produces a result similar in many ways to that of Compendium, and it can be used as a unique and powerful presentation tool. Also like Compendium they have a user community and a gallery that will tell you far more than I possibly can.

Budd points out some very significant differences between the mind map and the traditional, linear outline and states these have powerful implications for learning:

…note that each branch is captured by a single key word, not a phrase or sentence. Using single words reduces ideas to their core. Important ideas are not obscured by extraneous words, and new associations are not limited by more specific phrases. …The central point in the Mind Map must always be an image because the brain is drawn to an image more …differences in the size of the branches and the associated words are used to reinforce associations and to add emphasis. …the use of color is important in creating Mind Maps. …many Mind Maps use one color for each major category to aid in organization. …These differences can make Mind Maps powerful tools. …Research on memory and learning emphasizes the importance of associations, and the radiant structure of a Mind Map with explicit branches promotes associations. The use of color for different categories can also make more powerful associations. The use of emphasis in a Mind Map, for example with thicker main branches and larger printing, can also help the recall of information. The focus on using single key words can foster more expansive connections, and confining the entire Mind Map to a single piece of paper allows one to see the entire picture at once and perhaps stimulate additional associations.
(Budd, 2004:37-8)

Student-produced Effects of Labor Unions

Budd (2004) fig. 3 Student-produced Effects of Labor Unions

I should note that John Budd’s article is accompanied by samples of hand-drawn maps that, in my opinion, also reveal how far technology still has to go to match humans’ capacity for expression. Neither Compendium, nor from what I’ve seen so far VUE, has the ability to vary the width of connecting arrows, let alone supply the “branches” of a map with bark [n.b. Since first writing that sentence I’ve seen many others that do thicknesses (still no bark). See “Vic’s list” at the end of this post]. Educators can do much to influence the design of software by engaging directly with software developers and designers on social networks like Twitter. You do not need software to use mind maps in lesson plans.

Mind Maps can be used to add active and collaborative learning to courses. Students are engaged in active learning as they wrestle with ideas, associations, and categories in creating a Mind Map-they are creating their own Mind Map, not simply looking at one created by the instructor. The exercise is collaborative because the Mind Maps are created as a small group effort. A collaborative relationship between the instructor and students can also be established as the instructor helps with the constructions of the Mind Maps, but as a “guide on the side” not as the “sage on the stage” (Budd, 2004:42).

Because of the reliance on hierarchies, says Budd, concepts or classroom exercises that do not fit traditional outline structure are probably not good candidates for the creation of a mind map. Even in early explorations of collaborative concept mapping software I’ve noticed, in forum discussions and newsletters, a common motif that points to another criticism: mappers often say things like “this works for me” while maybe the internal logic isn’t quite as apparent to everyone. I believe such criticism can be overcome by perseverance, collaboration and openness to feedback.

I’ve experimented using Compendium to take notes in meetings, for sorting research, choosing between possible software solutions, and for planning (Conole & Fill, 2005). I’m now very interested in presentations using VUE. When it comes to mind mapping software I now often find myself saying, “This works for me.”

SOFTWARE SITES, in their own words:

The Compendium Institute (Open University and others) is an open forum for the ongoing development and dissemination of the Compendium methodology and software tools. Compendium is about sharing ideas, creating artifacts, making things together, and breaking down the boundaries between dialogue, artifact, knowledge, and data. http://compendium.open.ac.uk/institute/

The Visual Understanding Environment (VUE) is an Open Source project based at Tufts University. The VUE project is focused on creating flexible tools for managing and integrating digital resources in support of teaching, learning and research. VUE provides a flexible visual environment for structuring, presenting, and sharing digital information. https://vue.tufts.edu/

What surely must be the definitive list, “Vic’s compendium of software that supports knowledge management and information organisation in graphical form. Includes mind mappers, concept mappers, outliners, hierarchical organisers, KM support and knowledge browsers, 2D and 3D.” http://www.mind-mapping.org/

§


Reference

Budd, John W., (2004) Mind Maps as Classroom Exercises, The Journal of Economic Education, Vol. 35, No. 1 (Winter, 2004), pp. 35-46. [Available on line but missing accompanying graphics
www.legacy-irc.csom.umn.edu/faculty/jbudd/mindmaps/mindmaps.pdf, retrieved 2012-12-10]

Cognexus.org, recorded meeting 2012-12-12, Compendium Developer meeting, http://www.cognexus.org/Compendium_Futures/2012-12-12_C_Developer_Meeting.wmv, retrieved 2012-12-16.

Collins, A., Brown, J.S., and Holum, Ann (1991), Cognitive Apprenticeship: Making Thinking Visible, American Educator, [1991 reprint available on line at http://elc.fhda.edu/transform/resources/collins_brown_holum_1991.pdf accessed 2012-09-17].

Conole, G. and Fill, K. (2005), A learning design toolkit to create pedagogically effective learning activities, Journal of Interactive Media in Education 2005(08). [jime.open.ac.uk/2005/08].

McLeod, S. A. (2010). Kolb, The Learning Style Inventory. Retrieved from http://www.simplypsychology.org/learning-kolb.html 2012-12-03

Multimedia Learning by Richard E. Mayer (2009)

Dec 09

Educators see Twitter at the hub

Twitter infographic

Authenticity in learning can be understood as the extent to which the learning is situated within a practising community of people who share some united interest in the knowledge being sought or produced, and a common idea of its meaning and value, “…who share a concern or a passion for something they do and learn how to do it better as they interact regularly” (Wenger, 2006) Sociology is an integral element of the authentic learning environment.

  On Twitter’s 140-character limit…

Several authors have argued that rather than this being a drawback, this characteristic offers benefits for learning. Educause (2007) suggests this helps develop skills “in thinking clearly and communicating effectively”. Rankin (2009a & 2009b) notes that this forces students to focus on a central point. Dunlap & Lowenthal (2009) argue that communicating in this style is a “professionally useful skill for students to develop”.
…However this aspect of Twitter, …has also been blamed by academics for contributing to declining English writing skills (Kelley 2010).

There is now plentiful evidence that a growing number of educators, and many more who think of themselves as stakeholders in education generally, are using social networks, and more than a few sites and software applications have emerged to compete for parents’, students’, teachers’ and administrators’ attention, everywhere, all at once. There are powerful new ways to create, manage, and share your own resources and an overwhelming number of great resources available from others. While a site like Pinterest may drive a great deal of traffic to blogs the micro-blogging tool Twitter’s unique feature set has helped establish its role at the hub.

3 Ways Social networking impacts and supports learning

Social networking platforms and tools are already impacting and supporting learning in at least three ways. First, social networking itself is a tool with a skill set for learning. Second, social networking can be used to deliver and enhance curriculum. And third, social networking can be utilized to create learning experiences in collaboration with others. Teachers find individual articles such as 30 Twitter Hashtags For Science Lovers and 50 Ways to Use Twitter in the Classroom immensely helpful, but if my own timeline is an indication, they do add up! Most of probably hundreds of such no-doubt wonderful ideas often get swept away in the “digital noise.” A classroom teacher’s bookmarks can include Edmodo, YouTube, and Facebook, Teachhub, PBL-Online and Edudemic, but it’s increasingly clear that Twitter is the choice to join these spokes at the centre.

New Twitter users commonly describe an experience curve that travels from scepticism, trial participation, conversion (getting it), dramatically increasing usage and connections (Levine 2007, Stevens 2008, Seimens 2008, Shepherd 2009) through to potential overload (Sierra 2007).

Teachers use Twitter to plan field trips, chat with industry professionals, connect classrooms, facilitate research, post supplementary materials, to engage students in the classroom, parents outside the school, and colleagues and administrators in networks they can design according to need and interest.

It’s not surprising to learn that “design of teaching strategies and practices related to virtual engagement and collaboration is instrumental to achieving positive educational outcomes,” but some early research suggests not all are equally ready, that students may need “…to improve their capacity to initiate self-directed, collaborative practices as a means to more effectively take ownership of their learning” through incorporating new technology. (Junco, Elavsky, and Heiberger, 2012). Similarly for teachers, learning to use Twitter to grow an effective Personal Learning Network (PLN, a.k.a. Community or PLC) is not the same as learning to use it as a tool in a learning situation, in or out of the classroom.

What you Tweet, when you Tweet it, the length of your Tweets, whom you retweet and who retweets you are all factors in getting established on Twitter. You can over-use hashtags or under-use them, and good use of images in tweets can make your tweets up to twice as engaging.

TweetStats is a service that reveals a great deal of information about how people actually use Twitter. One tab shows how many Tweets happened, when, in reply to whom, from what kind of device, and top retweets for a particular user. On another you can visualize the data as a word cloud1 (called a TweetCloud, naturally) of top mentions and topics, and once you’ve done so for an account you can track follow and unfollow stats from that point forward. If you have an idea of a rubric2 demonstrating engagement and on-task behaviour, or other standards you wish to establish, either for your personal learning community or a learning experience you design, TweetStats can already report some enlightening information. It seems to me this is a direction in which educators can push for development, or show initiative by launching their own open source projects.

As a stakeholder in on line education, what other sets of data would you like to see in statistical reports? Must diagnostic, formative and summative assessments be built in? How would you do that? What would it look like?

§


Notes

  1. From visual design, a word cloud is a form of weighted list, a visual representation for text data. Usually the importance of each tag, word or phrase being highlighted is represented by variations in font size or color.
  2. A rubric is a measuring tool that experience designers can use to assess participant learning and engagement. Using a set of criteria and standards directly tied to the stated learning outcomes, educators can assess each student’s actual performance. When a rubric is agreed-upon and communicated prior to the student’s work being completed, it serves as a model or exemplar, and makes the grading process clear and transparent.

Reference

Brown, J.S., Collins, A., and Duguid, P. (1989). “Situated Cognition and the Culture of Learning.” Educational Researcher, 18(l), 32-42.

Davis, Gordon B., Editor (1986) Understanding The Effectiveness of Computer Graphics for Decision Support-A Cumulative Experimental Approach, Communications of the ACM, Vol 29 (1) 40-47.

Dugan, Lauren (2012) How Frequently Should You Tweet? [STATS] posted October 30, 2012 on AllTwitter The Unofficial Twitter Resource http://www.mediabistro.com/alltwitter/how-frequently-should-you-tweet-stats_b30568.

Ferriter, William M. (2010), Why Teachers Should Try Twitter (Meeting Students Where They Are), Educational Leadership, 67(5) February 2010, pp 73-74;
[Available on line http://www.ascd.org/publications/educational-leadership/feb10/vol67/num05/Why-Teachers-Should-Try-Twitter.aspx, retrieved 2012-11-30].

Junco, Reynol; Elavsky, C. Michael; and Heiberger, Greg (2012), “Putting twitter to the test: Assessing outcomes for student collaboration, engagement and success” British Journal of Educational Technology [Early View, Article first published online: 1 MAR 2012 available from author’s site: http://reyjunco.com/wordpress/pdf/JuncoElavskyHeibergerTwitterCollaboration.pdf, retrived 2012-11-30]

Lave, Jean and Wenger, Etienne (1991). Situated Learning: Legitimate Peripheral Participation. Cambridge: Cambridge University Press.

Lave, Jean (1996). Teaching, as Learning, in Practice, Mind, Culture, and Activity (3:3) pp149-164.

Webducate [‘webducate.net’ website/blog] (2012), Twitter in learning and teaching – literature review http://webducate.net/2012/08/twitter-in-learning-and-teaching-literature-review/, retrieved 2012-12-03

Wenger, E. (2006) Communities of practice, a brief introduction, http://www.ewenger.com/theory/, HTML retrieved 2011-11-03 or http://wenger-trayner.com/wp-content/uploads/2012/01/06-Brief-introduction-to-communities-of-practice.pdf, PDF retrieved 2011-10-03.

Nov 01

21st Century Cognitive Apprenticeship: 4 Ways We Make Thinking Visible

Back in 2005 Dorian Peters posted a summary of Mayer’s Principles for the design of Multimedia Learning I’ve visited frequently. I read it again today through the lens of cognitive apprenticeship and made some connections. Two essential components of apprenticeship models and multimedia design are narration and its timing, which is probably why software applications like Adobe Captivate, PowerPoint, or PowToons contain various ways to synchronize the appearance of objects with audio, visuals and text. The framework and principles can help form a checklist to improve the Who, What, When, Where, and How of choosing what to include in learning environments, all of which illuminate two distinct aspects of the Why — a given that someone wants to learn the stuff, and our ability to assess that including something in specific ways — or not — helps achieve that goal.

Mayer (2001, 2003, 2005) presented research-based principles for the design of multimedia messages. His fundamental principle is the multimedia principle itself: people learn better from words and pictures than from words alone. Peters has organized the principles into sets:

  • Principles for managing essential processing  more»
    • Segmenting principle: People learn better when a multimedia lesson is presented in learner-paced segments rather than as a continuous unit.
    • Pre-training principle: People learn better from a multimedia lesson when they know the names and characteristics of the main concepts.
    • Modality principle: People learn better from animation and narration than from animation and on-screen text.
  • Principles for reducing extraneous processing  more»
    • Coherence principle: People learn better when extraneous words, pictures, and sounds are excluded rather than included.
    • Redundancy principle: People learn better from animation and narration than from animation, narration, and on on-screen text.
    • Signaling principle: People learn better when the words include cues about the organization of the presentation.
    • Spatial contiguity principle: People learn better when corresponding words and pictures are presented near rather than far from each other on the page or screen.
    • Temporal contiguity principle: People learn better when corresponding words and pictures are presented simultaneously rather than successively.
  • Principles based on social cues  more»
    • Personalization principle: People learn better when the words are in conversational style rather than formal style.
    • Voice principle: People learn better when words are spoken in a standard-accented human voice than in a machine voice or foreign-accented human voice.
    • Image principle: People do not necessarily learn better from a multimedia lesson when the speaker’s image is added to the screen.
  • One last principle,” the Individual differences principle.  more»
    Design effects are stronger for low-knowledge learners than for high-knowledge learners. Design effects are stronger for high-spatial learners than for low-spatial learners.

More about these in a moment. These principles illustrate a point of mine: that what Collins, Brown, Duguid, Newman, Holum et al. (see my posts here and here) bring with their theory of cognitive apprenticeship is a practical framework by which to apply such good principles. Conversely, the principles can guide the how, when, who, where, and why of specific situations. Consider the statement that teachers (who may often be more generally deemed “designers” of learning experiences) should show the processes of the task and make them visible to students (Collins et al.., 1991:). The common root of processes and processing reveals the relationship. The set of essential processing principles informs the design and planning stages, with a strong nod to individualization. Extraneous processing are filters and fine-tuning strategies. Both sets speak to content, method and sequence in Collins’s language. The fourth member of that set in cognitive apprenticeship lingo is sociology, and Mayer offers guidance here as well.

I’m going to apply Mayer’s fundamental principle now and try to enhance this communication with narration and pictures. Maybe you’ve never thought of footnotes as technology before, but they are a highly developed device1, designed to make an author’s thinking visible.

I use this icon to exclaim or assert something. I assert that this is one way to make thinking visible. For a web site, it’s easy to use CSS to make a set of icons. available, as I’ve done for this one. Of course the meanings of the icons must be communicated throughout the community and a common understanding shared by those who use them. Press the letter N to open this “Note” showing my growing list. The letter U opens my Audio narration in which I discuss 4 simple things we’ve done within documents to make thinking visible, and how each can be enhanced with the 3 main Web technologies, HTML, CSS, and JavaScript.

Icons Used Here

  • Assertion 
  • Argument 
  • Audio 
  • Decision 
  • Web page 
  • Idea 
  • Issue 
  • List 
  • Idea Map 
  • Con 
  • Note 
  • + Pro 
  • Position 
  • Rubric 
  • Video 

This icon is not in the original Compendium set. I added it because I thought it filled a need.

Using icons is another thing on my list. It’s not a new idea, but applying it specifically when managing essential processing, thinking about segmenting and pre-training (prerequisite knowledge?) while imagining and planning authentic environments, or striving to reduce extraneous processing throughout demonstration and coaching phases. A consistent icon set provides coherence by signaling and providing cues about the content. For more ways, roll your mouse over the list icon, or press the L key to open my List. Press N to open a Note displaying the list. Press U to open my Audio narration for this content.

  • Icon sets
  • “More »” links  more»
    More links reduce extraneous information and communicate which points you think are important.
  • Footnotes2
  • Narration & animation

§


    Footnotes:
  1. Anthony Grafton, in The Footnote: A Curious History (1999) points to men like Pierre Bayle, who “…made the footnote a powerful tool in philosophical and historical polemics; and Edward Gibbon, who transformed it into a high form of literary artistry. Proceeding with the spirit of an intellectual mystery and peppered with intriguing and revealing remarks by those who “made” this history, The Footnote brings what is so often relegated to afterthought and marginalia to its rightful place in the center of the literary life of the mind…” (cover notes).
  2. With JavaScript the eye never has to leave the main text. It can count them for you, too!

References

Clark, R. C., & Mayer, R. E. (2003). E-learning and the Science of Instruction. San Francisco: Jossey-Bass. Mayer, R. E. (2001). Multimedia Learning New York: Cambridge University Press. Mayer, R. E. (Ed.). (2005). The Cambridge Hanbook of Multimedia Learning. New York: Cambridge University Press.

Grafton, Anthony (1999). The Footnote: A Curious History, Boston: Harvard University Press, 241 pages.

IDEO (2011). The Design Thinking Toolkit for Educators, http://www.designthinkingforeducators.com/, 94 pages.

Peters, Dorian (2005). Mayer’s Principles for the design of Multimedia Learning, blog http://designerelearning.blogspot.ca/2005/09/mayers-principles-for-design-of.html retrieved 2012-10-10.

Best new thing in my world today: Git

Aside

Git is version control software, sort of like “track changes” for an entire directory structure. But it has powers and abilities far beyond those of ordinary version control tools. Among other things it can move files — securely — between servers anywhere you have access to install it.

Why did I bother to learn Git?

My motivation was both intrinsic and extrinsic: I have experienced the deep feeling of chagrin that comes from knowing you’ve just overwritten hours of good work with an older version of a file. I already wanted to learn how to use Git because I had seen interesting projects on GitHub that I thought I might even be able to contribute to. The extrinsic motivation, and the reason I stopped procrastinating, is I now have to use it at work.

Did I have a strategy?

Having a project of my own allowed me to put many more hours into learning Git, and to use it for things I wouldn’t try at work for many weeks. At work I’m literally only expected to contribute to two files — one is CSS the other JavaScript. For my project I’m carrying around a laptop, but my biggest screen (and most comfortable coding chair) are at the desktop in my music-room. The desktop has 3 or 4 different web servers running on it, which I can access from anywhere on my home network. My learning strategy then was to set up as if I’m a team of people working from different computers on a network. I ended up setting up two repositories on each computer. I used a variety of Internet resources whenever I faced an impasse. I soon found several well-written sources that helped me.

What did I already know that helped me learn Git?

Almost immediately as I started working with Git I thanked the fact that I’ve installed and worked with various Linux flavors — Fedora and Ubuntu mainly, but others as well. Git runs on Windows in a Linux “shell” and you need to know about case-sensitivity and forward slashes. The most frightening and potentially alienating thing for any Windows user is probably Vim, the 20-year old text editor (and so much more) that Linux geeks will never abandon or bury. When you commit changes using commit -a a Vim terminal appears. When you start typing in Vim all hell breaks loose until you learn to press Insert up front, and you won’t get out with anything you type intact until you learn the sequence ESC : w q . I was lucky I went through that frustration a couple years earlier.

What surprised me about learning Git, or what did I learn that I didn’t expect to learn?

At one point I had to open a utility, Gitk, that comes with Git. Looking at the long list of commit messages I generated as the project evolved I realized I had inadvertently collected a log of my thought processes. If I were teaching something in a classroom and I could have my students keep a similar log while working on their projects I’d know what they were thinking at various stages, and perhaps gain all sorts of otherwise unexposed insights into both their learning and my teaching. I mentioned this thought to the IT program manager at work. His comment was he would love it if they taught Git in high school.

I’ll probably post more about working with Git. But don’t wait for me… get Git and all the documentation and tutorials you’ll probably ever need at git-scm.com/.

Mar 31

Project TinCan, the next stage in assessment and evaluation?

If you need to keep track of who does what, when, within a web-based project or experience TinCan might be just the thing.
—moi

The metaphor that gave name to Project Tin Can is the tin can and string telephone. Project Tin Can is the next phase of SCORM. The project itself has entered its own “Phase 3 — the future of e-learning is now,” which includes prototypes you can use, that in turn can issue data and reports, and web objects to be consumed in ways limited only by the imagination. Continue reading